OpenStreetMap User's Diaries
Kann Karten nicht mehr drucken!
Kann Karten nicht mehr drucken!
Kann Karten nicht mehr drucken!
Kann Karten nicht mehr drucken!
Kann Karten nicht mehr drucken!
Last Update
Monday, 30. June 2025 22:11
Subscriptions
Meta
Powered by Pluto. For changes to the feeds shown, please see our feed policy.
OPML feed of all feeds.
Kann Karten nicht mehr drucken!
Kann Karten nicht mehr drucken!
This is my my second day into the field of OSM, i went back and edited my home grown plce, yuh my home village and and waiting to welcome any reviews because i believe it is the right think to do and am welcoming any mistakes and am hoping to add many more places on the OSM today I went ahead and edited my villages by adding the various buildings and trees that haven’t been mapped yet
This is my my second day into the field of OSM, i went back and edited my home grown plce, yuh my home village and and waiting to welcome any reviews because i believe it is the right think to do and am welcoming any mistakes and am hoping to add many more places on the OSM today I went ahead and edited my villages by adding the various buildings and trees that haven’t been mapped yet
In this edition of our interview series with OpenStreetMap community members around the world, I chat with Jochen Topf.
Jochen is a very long-time member fo the OpenStreetMap community. He has been very active as a mapper, but also an organizer within the community, particularly in Germany. He is co-author of a book about OpenStreetMap (published in English as “OpenStreetMap: Using and Enhancing the Free Map of the World”), has spoken at many OpenStreetMap events over the years, and is a developer of some of the core OpenStreetMap software. He now works part-time for FOSSGIS e.V, the non-profit that serves as the local chapter of the OpenStreetMap Foundation in Germany (as an aside, we at OpenCage are proud to be corporate members of FOSSGIS and the OpenStreetMap Foundation).
Amongst much else Jochen is currently working on a project to broaden the level of financial support for OpenStreetMap in Germany, and I wanted to explore this topic as it has relevance for many OSM communities around the world.
1. Who are you and what do you do? What got you into OpenStreetMap?
My name is Jochen Topf. I have been active in the OpenStreetMap project since 2006. I started out as a mapper when the map was mostly empty and OSM was a good opportunity to get away from my computer and get some exercise on my bike while doing something useful for the world. I soon got into writing software for OSM, first as a hobby and later as a job. I work as a freelance software developer, mainly doing C++ development around my Osmium project and on osm2pgsql, but I also created and maintain taginfo and lots of other software. I have written a book about OSM and given many presentations about it. There is a long list of my OSM activities on my homepage.
For about 18 months now I also work part-time for FOSSGIS e.V., the German local chapter of the OSM Foundation, I am the only one getting paid to do OSM stuff there. My job is helping with communication and coordination inside and outside the OSM community. This is everything from updating our web site to writing statements about planned legislation in Germany that would impact the work of OSM, to helping government and other organisations understand, use, and contribute to OSM.
2. You are leading an effort to get more companies to financially sponsor OpenStreetMap in Germany, why? What is the current status of OpenStreetMap’s finances? Why does OSM need money? What is the goal of this project?
OpenStreetMap is widely used today. Everywhere you look you’ll find OSM maps and other products and services based on OSM. Some people consciously use OSM maps, but much more people use it without even knowing. Basically all the apps used for outdoor activities like hiking and mountain biking use OSM data, DHL plans their delivery routes with OSM, insurance companies give you discounts on your car insurance if you drive below the speed limit which they get from OSM, public transport companies calculate routes from platform to platform through complex train stations using OSM maps, emergency services are dispatched using OSM maps, and so on. OpenStreetMap is a public infrastructure that needs to be maintained. And there is much more that needs to be done than mapping. There are servers to run, software need to be updated, documentation needs to be written. And with the popularity of OSM come problems, problems like more strain on our servers and more vandalism, but also conflicts around what is allowed in the map and what not. More people affected by OSM maps means more questions, more need to explain what we are doing. Somebody has to deal with all of that. So far this has mostly been volunteers and while there are plenty of volunteers for mapping, there aren’t that many who get involved more deeply.
Generally OSM is severely underfunded, in Germany but also everywhere else in the world. The project we are most often compared to, Wikipedia, has 200 full-time staff in Germany alone. In OSM Germany, we struggle to pay one part-time staff. There are not even a dozen people in the world getting paid by the OSM Foundation and all its local chapters put together. It puts a lot of strain on the volunteers and a lot of work does not get done. And I believe it should be possible to work on good things like OSM and still make a living. There are lots of people out there who would like to contribute more but can’t, because they need to earn a living elsewhere.
So the idea is to get at least some of the companies and other organisations that use OSM extensively to give a little bit back to the project. Of course they could also become corporate members of the OSM Foundation, but it is easier for a German company to give something to a German non-profit and it is easier for us to approach local companies here. We’ll use that money to support our OSM activities in Germany, but also contribute resources and money to the international project.
3. How does this differ from becoming a corporate member of FOSSGIS?
In the international OSM Foundation, corporate members are very different from “normal” members. They don’t have voting rights and they pay a lot more money. Despite the name, corporate members are really more sponsors than members. This is different in the German FOSSGIS, where corporate members have voting rights like normal members do and don’t pay much more than normal members (just 200 EUR per year). This is just the way things were set up historically. We decided to leave this system in place but create a new supporter program that gives companies and other organizations a status that’s similar to corporate members in the OSMF but uses different terminology. The end goal is the same: Create a way to generate some income for OSM from those who use OSM the most and make a profit from it.
4. How to find a sustainable business model around open source software has been a long-running topic in the past decades. How does this translate to open data?
We are basically seeing the same problems and solutions. Because the “main thing” (the software/the data) is distributed for free, everybody has to find a way to charge for something extra. For software that’s often access to non-free add-ons, custom development or something like it. For data it can be processing of the data into a form that’s more useful for the client, like a finished map instead of the raw data. In the end it often comes down to: Is there somebody you can ask if you need some service that you don’t want to build yourself, and, if anything breaks, can you call them on the phone and get them to fix it. That’s what lots of companies want and are willing to pay for it. And that’s why there is a whole eco-system of companies around OSM.
5. Speaking for myself, as someone who has started and run various businesses, sometimes it is challenging to interact with the free-form OpenStreetMap “community”, where no one is really in charge. What advice do you have for businesses / organizations that want to engage with the OpenStreetMap community?
I think the first thing the business needs to realize is that OpenStreetMap is not one thing. OSM is much bigger and more diverse than most people realize, even most OSM community members themselves. You wouldn’t expect to be able to contact the one person responsible for the Internet either. So don’t try to find the person in charge. Instead, find somebody with more experience with OSM and listen to them.
Of course that’s easier said then done. How to find such a person? You might be able to find a local meetup or go to an event that has OSM people there. For Germany we have a list of events on our web site that are organized by the community or where OSM has a booth. You can also find a company with OSM experience and let them help you. Look for people who have given presentations about OSM at events for instance to get some idea of whom to contact. Be prepared to get frustrated and be willing to learn.
All that being said, I see it as our (the OSM communities) responsibility to do a better job at communicating with the rest of the world. This is one reason we need money, to pay people to do this communicating. In fact this is a large part of my job now, improving the openstreetmap.de website to include more information helping “outsiders” understand OSM, giving presentations on OSM and so on. And I am the point of contact in Germany for government and non-profit organisations.
6. Last year OpenStreetMap celebrated 20 years. As someone who has been very active in OSM in so many ways (mapper, software developer, founder of a company that relies on OSM, etc) for a long time, where do you think the project will be in another 20 years?
In the last years we have already been seeing a shift from OSM being a volunteer-only effort to a project where community, public and commercial interest work side by side to improve the map data. I think this trend will get even stronger over the next years and I believe in 20 years OSM will be part of the everyday public infrastructure that’s just there. When the Internet started to get big in the mid/late 1990ies, people debated whether their company or other organisation needed a presence on the web and complained how difficult and expensive it was to create a web site. Today, this isn’t even talked about any more. Everybody has a web site, you can create one yourself, large companies pay a marketing company or have in-house staff. There is a whole eco-system of services around the web. Every company, product, university project, NGO effort, or government activity has a web site. In 20 years many more people and organisations will contribute to OSM in one way or another. We’ll still have the volunteer community but also a lot of effort from companies, government agencies and so on contributing that part of the data which they know best. Some will do the work themselves, others will pay service companies to do the work, but everybody will contribute in some way because it just makes sense to be where everybody else is.
Thank you, Jochen! For the interview, but also for all of your work on and for OpenStreetMap over many years. One point really resonated with me: OpenStreetMap is more diverse than even most members of the community appreciate. The scale of the project is - in the truest sense - global. This is what makes OpenStreetMap so wonderful, but also so challenging.
Jochen, we wish you the best of luck in your efforts to broaden the size of the community and to help establish a solid financial foundation for further growth.
Happy mapping,
Please let us know if your community would like to be part of our interview series here on our blog. If you are or know of someone we should interview, please get in touch, we’re always looking to promote people doing interesting things with open geo data.
Centro comercial
Centro comercial
so i’m nearing my 10,000th edit on openstreetmap.
wild. i’ve been thinking a lot about what that actually means.
what started as a hobby - or maybe an obsession - has slowly become a record of care.
a way to see.
a way to let others see.
mapping Bangkok, piece by piece.
making it just a little more visible.
a little more precise.
a little more known - to others, <
so i’m nearing my 10,000th edit on openstreetmap.
wild. i’ve been thinking a lot about what that actually means.
what started as a hobby - or maybe an obsession - has slowly become a record of care.
a way to see.
a way to let others see.
mapping Bangkok, piece by piece.
making it just a little more visible.
a little more precise.
a little more known - to others,
and to myself.
i’ve been thinking a lot about maps.
about what this whole thing has meant - not just as a mapper,
but as a local voice,
a small thread in a bigger web, by others.
by myself.
by the place itself.
piece by piece.
making it just a little more visible.
a little more precise.
a little more known - to others,
and to myself.
-
i’ve always loved maps.
even when i didn’t know the word for what i was feeling.
as a kid, i was drawn to them like magnets.
atlases in bookshops. globes with soft pastel oceans.
the tiny maps printed on the backs of business cards.
spatial things made me feel calm.
made me feel like the world could be held in my hands.
Vast space compress into something compact, 2 dimensional.
-
my first game was simcity 4 - my dad played it.
i didn’t really get it,
but i still did play it.
a lot,
to much, maybe.
then came minecraft.
and yeah, like every gen z kid,
i was obsessed.
not the survival part.
i built cities.
creative model.
little parks and structures.
entire worlds.
i think i was looking for something i hadn’t seen yet in real life.
or maybe building the kind of place i wanted to see.
-
i still don’t know where the fascination comes from.
maybe it’s an autistic special interest.
maybe it’s just how i’ve always tried to make sense of things - through shapes,
through patterns,
through place.
-
it was the monsoon season of 2021.
midst of covid lockdown. my last year of high school.
rain on the roof every day.
i opened openstreetmap one night and… that was it.
the editor was slow, clunky, frustrating - but something about it felt right.
i mapped a street.
then my school.
then a neighborhood.
then a whole district.
and then i edit.
and edit.
like nothing else matters.
i know it’s not healthy.
i know i’m not supposed to feel this alive hunched over a screen, tracing lines, renaming bus stops, aligning satellite tiles until my eyes blur.
but it satisfies something.
something deep.
something hidden in a place i don’t have a name for.
a warm ache in the center of me that only quiet edits can soothe.
so i keep going.
i expand.
translating tools like josm into thai, writing wiki articles, answering forum posts like i’ve been part of this community forever.
and maybe i have.
maybe this is my hometown, too.
not the real one, but the mapped one.
the shared one.
the infinite, editable one.
and now i’m here.
thousands of edits later.
still tracing, still tagging.
still trying to name things.
still looking for a way to understand the world a little better.
openstreetmap is familiar to me now.
like an old friend.
like a ritual.
and somewhere along the way i realized -
i believe in open-source.
i believe in open-content.
i believe geographical data is a human right.
i believe it should be free.
for everyone.
forever.
and yes -
i do love openstreetmap <3
-
thanks for reading. if you’re here, you probably get it.
-
🗺️✳️
krittin
Continu
19/06/2025-25/06/2025

[1] | © jaz-michaelking | Map tiles by CartoDB – Powered by uMap | Map data © OpenStreetMap Contributors.
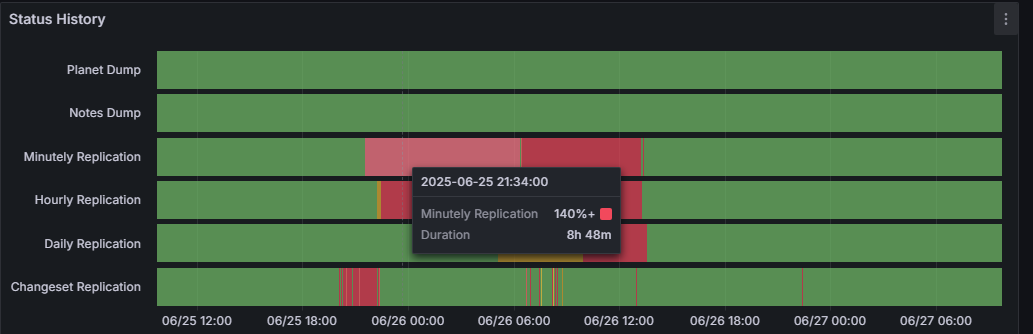
On Wednesday 25 June at 21:43 UTC the OpenStreetMap Grafana dashboard indicated an issue with the minutely replication diffs not updating. This disruption led to several downstream problems; most notably, newly uploaded changesets could neither be queried on the map nor rendered. The issue was first reported by community member queenofthenightosphere at 23:37 UTC. The OSM services that rely on this diff stream to stay in sync with the live database, including the Overpass API, tile rendering, Nominatim, and others, stopped updating. While the changesets were safely stored, they could not be accessed through these services due to the sync failure.
 about the PublicArtExplorer, an application developed by Thomas Zell that allows you to discover and explore public art around you in just two clicks. The app uses your location to instantly reveal nearby sculptures, murals, and installations, complete with detailed information about each piece and its artist. The PublicArtExplorer’s data is based on OpenStreetMap and Wikipedia and is available for Android.
type=restriction relations, displaying information about deleted users, filtering notes on the map, a ruler for measuring distances on the map, and the ability to move node POIs. Previous updates had also added links to 3D renderings of buildings, the ability to partially revert changesets via osm-revert, and filtering changesets in the user’s heatmap. The source code is available on GitHub.
| Country | Where | Venue | What | Online | When |
|---|---|---|---|---|---|
 |
Saint-Étienne | Zoomacom | Rencontre Saint-Étienne et sud Loire |
2025-06-30 | |
 |
Žilina | FRI UNIZA | Missing Maps mapathon Žilina #18 |
2025-07-01 | |
 |
Derby | The Brunswick, Railway Terrace, Derby | East Midlands Pub Meet-up |
2025-07-01 | |
| Missing Maps London: (Online) Mapathon [eng] |
2025-07-01 | ||||
 |
Stuttgart | Stuttgart | Stuttgarter OpenStreetMap-Treffen |
2025-07-02 | |
 |
Wageningen Campus, Omnia | FOSS4GNL 2025 |
2025-07-02 – 2025-07-03 | ||
| iD Community Chat |
2025-07-02 | ||||
| UN Mappers #ValidationFriday Mappy Hour: Waterways |
2025-07-04 | ||||
 |
Bogotá | Remote | Mapping Party Semanal LATAM Weekly LATAM Mapping Party |
2025-07-04 | |
|
Pforzheim | VPE Verkehrsverbund Pforzheim-Enzkreis, | 3. OSMS meets VPE |
2025-07-05 | |
 |
Ghaziabad | Vaishali | OSM India monthly mapping party (online) |
2025-07-06 | |
 |
San Jose | Online | South Bay Map Night |
✓ | 2025-07-09 |
|
Hamburg | Voraussichtlich: "Variable", Karolinenstraße 23 | Hamburger Mappertreffen |
2025-07-08 | |
|
Online | OpenStreetMap Midwest Meetup |
✓ | 2025-07-11 | |
| OSMF Engineering Working Group meeting |
2025-07-11 | ||||
|
Berlin | Parzelle III/23b, Kleingartenkolonie Johannisberg, | OSM-Stammtisch Berlin-Brandenburg |
2025-07-11 | |
 |
København | Cafe Mellemrummet | OSMmapperCPH |
2025-07-13 | |
|
Ghaziabad | Vaishali | 18th OpenStreetMap Delhi Mapping Party |
2025-07-13 | |
 |
MZ Centar II | FOSS4G Europe 2025 |
2025-07-14 – 2025-07-20 | ||
 |
臺北市 | MozSpace Taipei | OpenStreetMap x Wikidata Taipei #78 |
2025-07-14 |
Note:
If you like to see your event here, please put it into the OSM calendar. Only data which is there, will appear in weeklyOSM.
This weeklyOSM was produced by HeiGIT, MatthiasMatthias, Raquel Dezidério Souto, Strubbl, Andrew Davidson, barefootstache, derFred.
We welcome link suggestions for the next issue via this form and look forward to your contributions.
مدينة أبوقير الجديدة
مدينة أبوقير الجديدة
This project began with my own steps — capturing street-level imagery from Daffodil International University to Eastern University, Dhaka, Savar. Using Mapillary, I documented the road to support open mapping.
These images aren’t just photos — they’re vital pieces that will directly support and enhance OpenStreetMap. Every frame contribu
This project began with my own steps — capturing street-level imagery from Daffodil International University to Eastern University, Dhaka, Savar. Using Mapillary, I documented the road to support open mapping.
These images aren’t just photos — they’re vital pieces that will directly support and enhance OpenStreetMap. Every frame contributes to a bigger, collaborative mission: building a better, more accurate map for everyone.
The journey is still ongoing, day by day. Feel free to share any powerful screenshots — let’s map the future, together. 🌍
are eligible for free unlimited map downloads and live updates. To qualify: Enable the OpenStreetMap Editing plugin. Log in with your OSM username. Maintain at least 30 edits over the last two months.
?_highlight=live#free-for-osm-mappers
Alhamdullilahirrabilaalaameen!are eligible for free unlimited map downloads and live updates. To qualify: Enable the OpenStreetMap Editing plugin. Log in with your OSM username. Maintain at least 30 edits over the last two months.
?_highlight=live#free-for-osm-mappers
Hello everyone,
I would like to request the addition of a missing village to OpenStreetMap. The village is called Charchall, located in the Akre District, Sawsana Subdistrict, Duhok Governorate, in the Kurdistan Region of Iraq.
Basic information:
🏘️ Village name: Charchall
🗺️ District: Akre
🏞️ Subdistrict: Sawsana
🏴 Governorate: Duhok – Kurdistan R
Hello everyone,
I would like to request the addition of a missing village to OpenStreetMap. The village is called Charchall, located in the Akre District, Sawsana Subdistrict, Duhok Governorate, in the Kurdistan Region of Iraq.
Basic information:
🏘️ Village name: Charchall
🗺️ District: Akre
🏞️ Subdistrict: Sawsana
🏴 Governorate: Duhok – Kurdistan Region, Iraq
🧾 Postal Code: 24005
🛣️ Main connecting road: Charchall Road
📍 Nearby village: benatah
This village is recognized by local government maps, but it is still missing from OpenStreetMap. We kindly ask for it to be added so that the area can be better represented for residents, navigation, and future development.
(esp. ref / spé. ref)
zone(esp. ref / spé. ref)
none
none
Today is my introduction to OSM through an internship process by Mr Samson who take as through an online intern, we are getting into it before you know it and this will mark the start of one of the greatest open street mappers who has ver been born, am actually learning a lot from this process and looking forward to contributing so much to the members of the community, we wanna make Uganda great
Today is my introduction to OSM through an internship process by Mr Samson who take as through an online intern, we are getting into it before you know it and this will mark the start of one of the greatest open street mappers who has ver been born, am actually learning a lot from this process and looking forward to contributing so much to the members of the community, we wanna make Uganda great and make my village the best in the world
♦ En las ciencias geoespaciales y la inteligencia de ubicación, las isócronas representan áreas geográficas accesibles en un tiempo determinado desde un punto específico. Por ejemplo, en el contexto de las distancias a pie, las isócronas son herramientas útiles para profesionales como los urbanistas que buscan comprender la accesibilidad y la conectividad d
 En las ciencias geoespaciales y la inteligencia de ubicación, las isócronas representan áreas geográficas accesibles en un tiempo determinado desde un punto específico. Por ejemplo, en el contexto de las distancias a pie, las isócronas son herramientas útiles para profesionales como los urbanistas que buscan comprender la accesibilidad y la conectividad dentro de un área determinada.
Al visualizar las isócronas, la ciencia de datos puede proporcionar una herramienta rápida y fácil de usar para ayudar a obtener información sobre el nivel de conectividad y accesibilidad a pie de los vecindarios, ayudar a identificar áreas que están bien conectadas y señalar áreas potenciales de mejoras de infraestructura.
En este artículo, explico cómo generar isócronas de distancia a pie mediante los paquetes de Python NetworkX (diseñado para análisis de grafos) y OSMNnx (que combina OpenStreetMap y NetworkX). Tomamos como ejemplo Perímetro urbano de la ciudad de Popayán. Primero, descargamos la red vial del área, seleccionamos un nodo aleatorio (una intersección aleatoria) y dibujamos las isócronas de distancia a pie de 5, 10, 20 y 30 minutos a su alrededor.
Primero, importaremos OSMnx y lo usaremos para descargar los límites administrativos del área objetivo. Puede reemplazarlo por el nombre de cualquier lugar que prefiera, que puede consultar fácilmente en OpenStreetMap. A continuación, usaremos OSMnx para descargar la red vial del área objetivo y mostrar el tamaño de esta red de nodos en términos de número de intersecciones y segmentos viales. Además, debemos especificar el tipo de red , que ahora está configurado como “walk” para obtener solo las partes transitables de la red vial.
# Importing osmnx
import osmnx as ox

# Configurar Matplotlib para visualización si es necesario
# import matplotlib.pyplot as plt

# Definir el polígono para la ciudad de Popayán, Cauca, Colombia
# Es importante ser específico para que OSMnx identifique correctamente el área.
# Puedes probar con diferentes niveles de especificidad si la primera no funciona,
# por ejemplo: 'Popayán, Colombia' o 'Popayán'.
# 'Perímetro urbano de Popayán, Cauca, Colombia' es un buen punto de partida.
print("Geocodificando la ciudad de Popayán...")
try:
    admin_district = ox.geocode_to_gdf('Perímetro urbano de Popayán, Cauca, Colombia')
    print("Geocodificación exitosa.")
except Exception as e:
    print(f"Error al geocodificar Popayán: {e}")
    print("Asegúrate de que la cadena de ubicación sea correcta y haya conexión a internet.")
    # Puedes probar con una cadena menos específica si da error, como 'Popayán, Colombia' o 'Popayán'
    admin_district = ox.geocode_to_gdf('Popayán, Colombia') # Intento alternativo

# Muestra el polígono en un gráfico (opcional, para verificar que es correcto)
print("Mostrando el polígono geocodificado...")
admin_district.plot()
# Si estás en un entorno interactivo como Jupyter, la trama se mostrará automáticamente.
# Si estás en un script .py, puedes añadir plt.show() al final para que la ventana del gráfico aparezca.
# plt.show()

# Extraer la geometría del polígono de la primera fila del GeoDataFrame
# Asumimos que el primer resultado es el correcto para la ciudad de Popayán.
# Puedes inspeccionar admin_district si hay múltiples geometrías.
admin_poly = admin_district.geometry.values[0]

# Guardar imagen del mapa
png_path = os.path.join(output_dir, "map.png")
plt.savefig(png_path, dpi=300, bbox_inches='tight')

# Cargar el grafo de la red de calles dentro de ese polígono
print("Cargando el grafo de la red de calles de Popayán...")
G = ox.graph_from_polygon(admin_poly, network_type='walk')
print("Grafo cargado exitosamente.")

print('\nAnálisis de la red de calles de Popayán:')
print('Número de intersecciones (nodos): ', G.number_of_nodes())
print('Número de segmentos de carretera (aristas):',  G.number_of_edges())

# Opcional: Visualizar el grafo
# print("\nVisualizando el grafo...")
# fig, ax = ox.plot_graph(G, figsize=(10, 10), node_size=0, edge_linewidth=0.5, show=False, close=False)
# plt.title("Red Peatonal de Popayán")
# plt.show()
Ahora, construyamos los polígonos isócronos de transitabilidad. Para ello, primero, asumimos una velocidad promedio de caminata de 5 km/h (1,39 m/s) y, con esta velocidad, asignamos un tiempo de caminata a cada borde de la red vial. Luego, seleccionamos un nodo aleatorio para comenzar y definimos la lista de rangos de transitabilidad: 5, 10, 20 y 30 minutos.
Para crear los polígonos de accesibilidad, primero usamos la función integrada de NetworkX llamada _ego graph , que devuelve un subgrafo específico de la red vial original que contiene todos los nodos dentro de un radio determinado, según las métricas de distancia que elijamos. Si seleccionamos _travel time , podemos devolver el subgrafo accesible en un tiempo determinado y almacenarlo como un atributo de borde llamado _travel time .
Luego, necesitamos extraer todas las coordenadas de los nodos de este subgrafo, que almacenaremos en la lista _node points . Finalmente, las convertimos en un polígono, lo graficamos y lo guardamos para la siguiente sección.
El resultado: todos los polígonos isócronos de transitabilidad, para 5, 10, 20 y 30 minutos, respectivamente
# Define the walking speed (5 km/h -> 1.39 m/s)
walking_speed = 1.39  # in meters per second

# Calculate travel time for each edge
for u, v, data in G.edges(data=True):
    # Calculate travel time in seconds
    data['travel_time'] = data['length'] / walking_speed

# Pick a center node
center_node = list(G.nodes())[30]  # starting point

# Generate isochrones
isochrone_times = [5, 10, 20, 30]  # isochrones in minutes

# Library imports
import networkx as nx
from shapely.geometry import Point, Polygon
import geopandas as gpd

isochrone_polys = []

for time in isochrone_times:
    subgraph = nx.ego_graph(G,
                            center_node,
                            radius=time*60,
                            distance='travel_time')

    node_points = [Point((data['x'], data['y']))
                   for node, data in subgraph.nodes(data=True)]

    polygon = Polygon(gpd.GeoSeries(node_points).unary_union.convex_hull)
    gpd.GeoDataFrame([polygon], columns = ['geometry']).plot()
    isochrone_polys.append(gpd.GeoSeries([polygon]))
Por último, utilicemos Matplotlib y la coloración de rojo a verde para trazar y visualizar las isócronas sobre la red de carreteras.
import os

# Crear carpeta de salida (si no existe)
output_dir = "isochrones_popayan"
os.makedirs(output_dir, exist_ok=True)

import matplotlib.pyplot as plt
import matplotlib.patches as mpatches
import osmnx as ox
import networkx as nx
import geopandas as gpd


ox.settings.use_cache = True
ox.settings.log_console = True

# 1. Obtener geometría de Popayán
admin_district = ox.geocode_to_gdf('Perímetro urbano de Popayán, Cauca, Colombia')
polygon = admin_district.geometry.iloc[0]

# 2. Descargar red caminable
G = ox.graph_from_polygon(polygon, network_type='walk', simplify=True)

# 3. Proyectar grafo a CRS métrico
G_proj = ox.project_graph(G)
nodes_proj = ox.graph_to_gdfs(G_proj, nodes=True, edges=False)

# 4. Nodo de inicio: centroide proyectado

# Coordenadas del punto inicial (WGS84)
lat, lon = 2.441901, -76.606439

# Crear GeoSeries y proyectar al CRS del grafo
point_wgs = gpd.GeoSeries([gpd.points_from_xy([lon], [lat])[0]], crs="EPSG:4326")
point_proj = point_wgs.to_crs(G_proj.graph['crs'])
x, y = point_proj.geometry.iloc[0].x, point_proj.geometry.iloc[0].y

# Obtener el nodo más cercano a esas coordenadas proyectadas
center_node = ox.distance.nearest_nodes(G_proj, X=x, Y=y)


# 5. Definir tiempos y distancias
trip_times = [5, 10, 15, 20]  # minutos
meters_per_minute = 80  # m/min
travel_distances = [t * meters_per_minute for t in trip_times]

# 6. Generar polígonos de isócrona
def make_iso_polys(G, center_node, distances):
    polys = []
    for dist in distances:
        subgraph = nx.ego_graph(G, center_node, radius=dist, distance='length')
        nodes_gdf = ox.graph_to_gdfs(subgraph, nodes=True, edges=False)
        if not nodes_gdf.empty:
            union = nodes_gdf.unary_union
            buffered = gpd.GeoSeries([union]).buffer(100)  # Aumentar buffer para visibilidad
            polys.append(buffered)
        else:
            polys.append(gpd.GeoSeries())
    return polys

isochrone_polys = make_iso_polys(G_proj, center_node, travel_distances)

# 7. Visualización
fig, ax = plt.subplots(figsize=(10, 10))
colors = ['red', 'orange', 'yellow', 'green']

# Dibujar isócronas
for idx, (poly, time) in enumerate(reversed(list(zip(isochrone_polys, trip_times)))):
    if not poly.empty and not poly.is_empty.all():
        poly.plot(ax=ax, color=colors[idx], alpha=0.4)
        poly.boundary.plot(ax=ax, color=colors[idx], linewidth=2)

# Leyenda manual
handles = [
    mpatches.Patch(color=colors[idx], alpha=0.5, label=f'{time} min')
    for idx, time in enumerate(reversed(trip_times))
]

ox.plot_graph(G_proj, ax=ax, node_size=0, edge_linewidth=0.5, show=False)
ax.set_title("Isócronas desde el centro de Popayán, Cauca", fontsize=15)
plt.legend(handles=handles)
plt.tight_layout()

# Guardar imagen del mapa
png_path = os.path.join(output_dir, "isochrones_map.png")
plt.savefig(png_path, dpi=300, bbox_inches='tight')


plt.show()
OsmAPP is the one integrated app for OpenStreetMap ecosystem for both web and mobile. It should be as easy to use as Google Maps, but fully open-source using all the great services around. It was first aimed at broad public, but now it becomes apparent, that it works best for the OpenStr
OsmAPP is the one integrated app for OpenStreetMap ecosystem for both web and mobile. It should be as easy to use as Google Maps, but fully open-source using all the great services around. It was first aimed at broad public, but now it becomes apparent, that it works best for the OpenStreetMap contributors, who want better UX or share OSM around.
Special thanks to all our 6 contributors in this release. 🎉
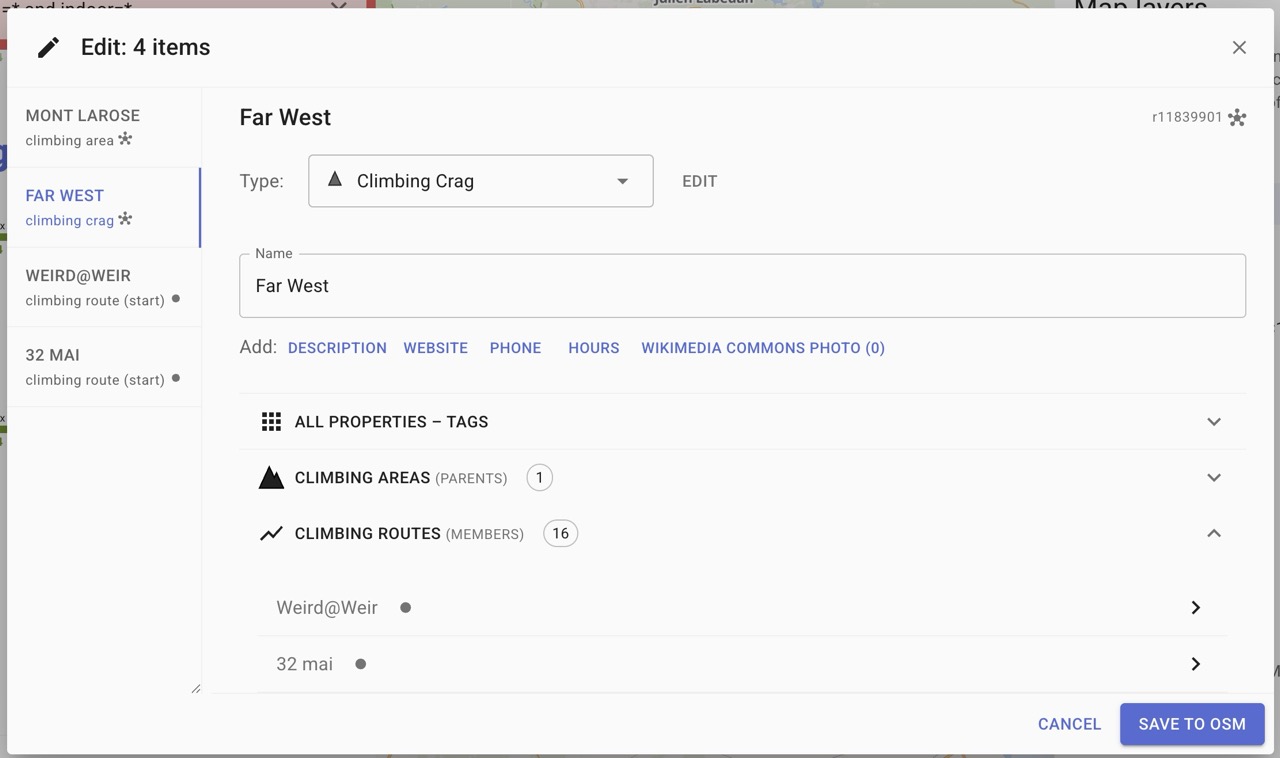
The main feature of this release is the reworked Edit dialog with the new Relation editor. That took a lot of work and refactoring. Now if you click (or create) a relation, you can browser through its members and its parents and easily edit metadata accross whole hierarchies.
It is the most useful on hierarchies like the climbing=area, climbing=crag and routes (example here), but it is written in general manner and can help OSM contributors in unexpected ways.
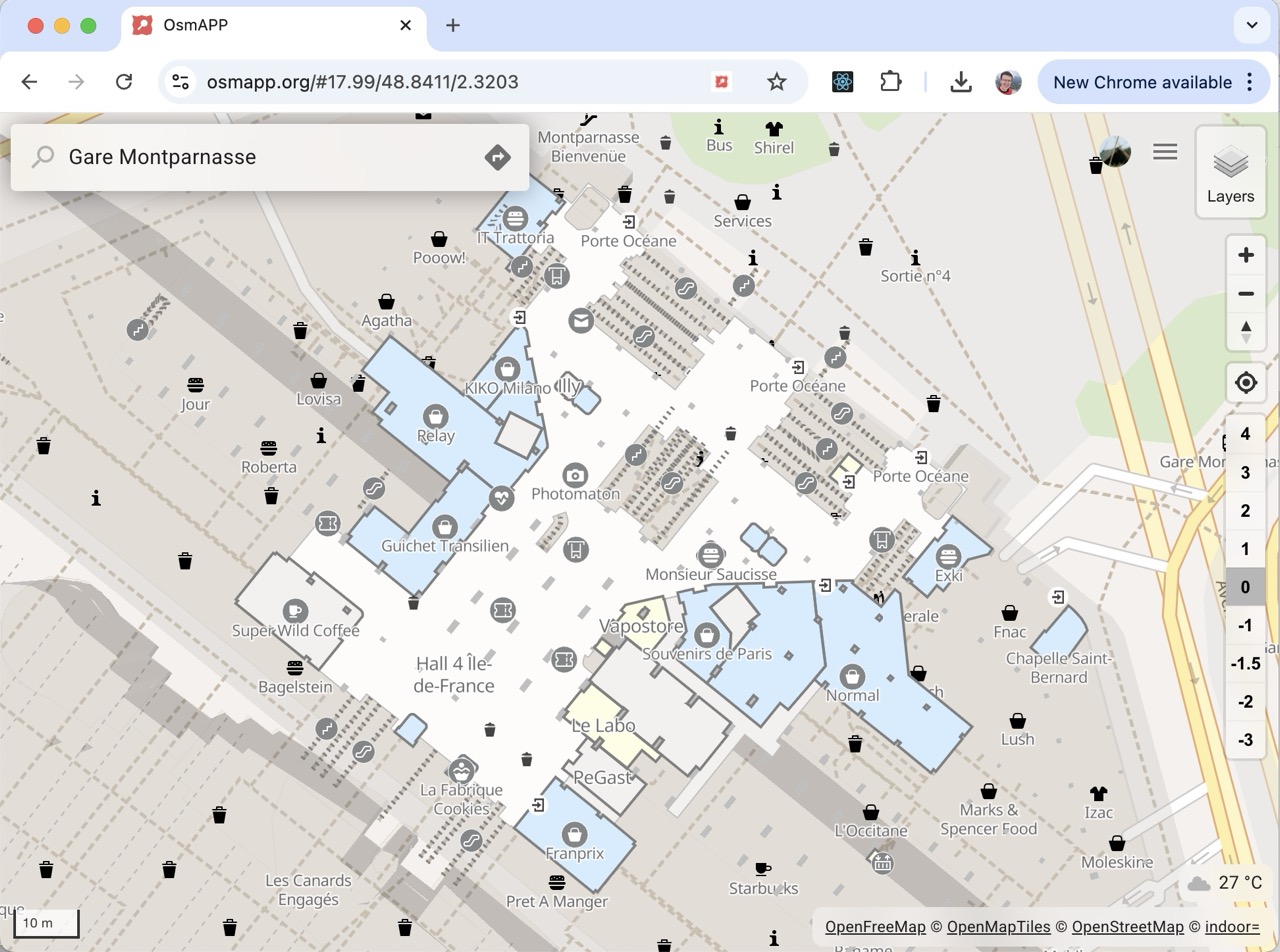
Thanks to @francois2metz who created vector tiles for indoor features (indorequeal.com), you can now browse inside of buildings, where it is mapped with level=* and indoor=* tags. (Example). Or find some examples in your neighborhood with query: level=* and indoor=* which you can enter in the search box (or link)
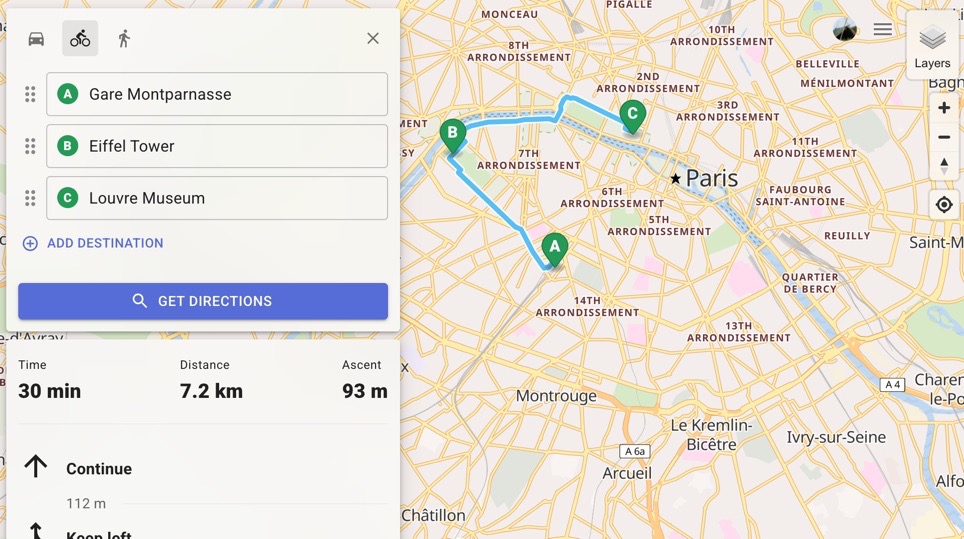
Directions form has evolved to the industry standard. You can add multiple destinations, drag&drop them, click the map, drag the markers or choose “My location”. Thanks to @jvaclavik for development, and @karussell for providing a free tier on the Graphhoper.com. ❤️
One fun addition was to develop a custom “masonry-style” preview image, when an OSM feature links to a Wikimedia Commons Category. OsmAPP now download first 10 images and tries to fit them in a nice collage. You can explore OSM items in your vicinity by executing this Overpass query in the OsmAPP searchbox: op:nwr["wikimedia_commons"~"Category"]
(or link).
OpenClimbing.org is a standalone app for using the rock climbing data in OpenStreetMap. It is fully based on OsmAPP and with this release we celebrate the public launch of the service.
You can read more in a dedicated blogpost: HERE
amenity=* or op:<query>)editor-layer-index listWe are looking forward to any feedback!
Thank you for your support!
@zbycz and @jvaclavik
The goal of openclimbing.org is to offer a non-commercial alternative to traditional climbing apps. Instead of filling private databases, we decided to design a structure for mapping climbing routes directly into OpenStreetMap.
This way, all data in the app is fully open and can be freely used or edited by anyone.
♦ Image: Crag with marked climbing routes in Hlubočepy, Czechia
The goal of https://openclimbing.org is to offer a non-commercial alternative to traditional climbing apps. Instead of filling private databases, we decided to design a structure for mapping climbing routes directly into OpenStreetMap.
This way, all data in the app is fully open and can be freely used or edited by anyone.
 Image: Crag with marked climbing routes in Hlubočepy, Czechia
Both the database and the code are completely open, so anyone can contribute with content or code. Thanks to the open data approach, anyone can create new ways to use or visualize the data.
Each climbing route has defined GPS coordinates, making it easier to find in the terrain. This is big advantage but also a limitation – you cannot add routes without it.
 Image: Climbing routes on the map
 Image: Kačák climbing area, Czechia
 Image: Uskedalen climbing area, Norway

We are looking forward to any feedback!
Thank you for your support.
@zbycz and @jvaclavik
Geofabrik is pleased to support the OpenStreetMap community as a bronze sponsor of two upcoming conferences in 2025:
We have been regular sponsors of SotM events for many years, including regional conferences such as FOSSGIS. Our staff have also contributed by speaking at various sessions over time.
Events like SotM offer a useful opportunity for exchange within the OpenStreetMap ecosystem. While much of the work in the OSM world happens remotely, occasional in-person meetings remain valuable for maintaining collaboration and perspective.
Sponsorship opportunities are still available for both events for those interested in supporting the community.
UM980 is relatively affordable chip allowing multi-constellation multi-frequency GNSS with capability to provide raw phase measurements and hence potentially suitable for use in OpenStreetMap environment for precise mapping susing RTK.
In this post (or potentially series of posts), I will document my experiences with using UM980 with RTKLIB and other open-source or free tools.
HardwUM980 is relatively affordable chip allowing multi-constellation multi-frequency GNSS with capability to provide raw phase measurements and hence potentially suitable for use in OpenStreetMap environment for precise mapping susing RTK.
In this post (or potentially series of posts), I will document my experiences with using UM980 with RTKLIB and other open-source or free tools.
The module can easily be configured using UPrecise tool coming with UM980. It is advisable to have faster than default COM port rate ~~~ CONFIG COM1 230400 ~~~ and use the signal group 2 (note that this leads to reset of the UM980 module ~~~ CONFIG SIGNALGROUP 2 ~~~
If you need to stop the stream of measured data, you can use ~~~ UNLOG ~~~ You can also UNLOG just specific messages.
If you want to store your config of the module so that it survives unplugging and restarting the module, use ~~~ SAVECONFIG ~~~
This is to collect the raw data in real time. The last RTKGPS+ tool is release is unfortunately relatively old and hence does not support, so the native UniCore support, which is available in demo5_b34L version of RTKLIB, is not yet available in RTKGPS+. Hence it is mostly useful for collecting raw data, rather than providing real-time solutions. If you want to collect the data, choose BINEX as the format and just log the input stream from the USB. This is how to configure the module:
CONFIG PPP DISABLE

OBSVMB 1

GPSEPHB 120
BDSEPHB 120
BD3EPHB 120
GLOEPHB 120
GALEPHB 120

GPSIONB 120
BDSIONB 120
BD3IONB 120
GALIONB 120
If you want to have faster measurements, you can use ~~~ OBSVMB 0.2 ~~~ But it may be then advisable to use at least 240kbaud rate of the COM port (which is generally well supported by RTKGPS+).
The input stream configuration is 230400/8-N-1 and format to store the data is BINEX.
Alternatively, one can attempt to use it using undocumented mode of UM980 to produce binary data compatible data: ~~~ RANGEB COM1 0.2 ~~~ However, I had problem that only very poor solutions were found, with only using GLONASS and Galileo constellation - probably due to lack of ephemeris included (use of “CONFIG ALLEPHRTCM ENABLE” option is still to be explored).
Then the input format is NovAtel OEMV/4.
It is possible to use the RTKGPS+ to log also the data from the base, a nearby coming from IGS or from EUREF (both requiring a free registration) and store the data in RTCM 3 format.
This is an example how to use PPP on the UM980 module and collect the data using SW Maps. ~~~ CONFIG PPP ENABLE E6-HAS CONFIG PPP DATUM WGS84 CONFIG PPP TIMEOUT 120 CONFIG PPP CONVERGE 15 30
GPGGA 0.2 GPGSA 1 GPGST 1 GPGSV 1 GPGLL 1 GPGNS 1 GPRMC 1 ~~~
This assumes use of demo5_b34L version of RTKLIB or later. Once the data is captured using RTKLIB, one can process the data using convbin and rtkpost from RTKLIB to process the data
convbin -od -os -oi -ot  rover_20250626042937.unc
convbin -od -os -oi -ot  base_20250626042937.rtcm3
# rtkpost options (2025/06/26 04:39:16, v.demo5 b34L)

pos1-posmode       =kinematic  # (0:single,1:dgps,2:kinematic,3:static,4:static-start,5:movingbase,6:fixed,7:ppp-kine,8:ppp-static,9:ppp-fixed)
pos1-frequency     =l1+l2+l5+l6 # (1:l1,2:l1+l2,3:l1+l2+l5,4:l1+l2+l5+l6)
pos1-soltype       =combined   # (0:forward,1:backward,2:combined,3:combined-nophasereset)
pos1-elmask        =15         # (deg)
pos1-snrmask_r     =off        # (0:off,1:on)
pos1-snrmask_b     =off        # (0:off,1:on)
pos1-snrmask_L1    =38,38,38,38,38,38,38,38,38
pos1-snrmask_L2    =0,0,0,0,0,0,0,0,0
pos1-snrmask_L5    =0,0,0,0,0,0,0,0,0
pos1-snrmask_L6    =0,0,0,0,0,0,0,0,0
pos1-dynamics      =on         # (0:off,1:on)
pos1-tidecorr      =0          # (1:solid+2:otl+4:spole)
pos1-ionoopt       =brdc       # (0:off,1:brdc,2:sbas,3:dual-freq,4:est-stec,5:ionex-tec,6:qzs-brdc)
pos1-tropopt       =saas       # (0:off,1:saas,2:sbas,3:est-ztd,4:est-ztdgrad)
pos1-sateph        =brdc       # (0:brdc,1:precise,2:brdc+sbas,3:brdc+ssrapc,4:brdc+ssrcom)
pos1-posopt1       =off        # (0:off,1:on)
pos1-posopt2       =off        # (0:off,1:on)
pos1-posopt3       =off        # (0:off,1:on,2:precise)
pos1-posopt4       =off        # (0:off,1:on)
pos1-posopt5       =off        # (0:off,1:on)
pos1-posopt6       =off        # (0:off,1:on)
pos1-exclsats      =           # (prn ...)
pos1-navsys        =47         # (1:gps+2:sbas+4:glo+8:gal+16:qzs+32:bds+64:navic)
pos2-armode        =fix-and-hold # (0:off,1:continuous,2:instantaneous,3:fix-and-hold)
pos2-gloarmode     =fix-and-hold # (0:off,1:on,2:autocal,3:fix-and-hold)
pos2-bdsarmode     =off        # (0:off,1:on)
pos2-arfilter      =on         # (0:off,1:on)
pos2-arthres       =3
pos2-arthresmin    =3
pos2-arthresmax    =3
pos2-arthres1      =0.1
pos2-arthres2      =0
pos2-arthres3      =1e-09
pos2-arthres4      =1e-05
pos2-varholdamb    =0.1        # (cyc^2)
pos2-gainholdamb   =0.01
pos2-arlockcnt     =0
pos2-minfixsats    =4
pos2-minholdsats   =5
pos2-mindropsats   =10
pos2-arelmask      =15         # (deg)
pos2-arminfix      =100
pos2-armaxiter     =1
pos2-elmaskhold    =15         # (deg)
pos2-aroutcnt      =20
pos2-maxage        =30         # (s)
pos2-syncsol       =off        # (0:off,1:on)
pos2-slipthres     =0.05       # (m)
pos2-dopthres      =0          # (m)
pos2-rejionno      =1          # (m)
pos2-rejcode       =10         # (m)
pos2-niter         =1
pos2-baselen       =0          # (m)
pos2-basesig       =0          # (m)
out-solformat      =llh        # (0:llh,1:xyz,2:enu,3:nmea)
out-outhead        =on         # (0:off,1:on)
out-outopt         =on         # (0:off,1:on)
out-outvel         =off        # (0:off,1:on)
out-timesys        =gpst       # (0:gpst,1:utc,2:jst)
out-timeform       =hms        # (0:tow,1:hms)
out-timendec       =3
out-degform        =deg        # (0:deg,1:dms)
out-fieldsep       =
out-outsingle      =on         # (0:off,1:on)
out-maxsolstd      =0          # (m)
out-height         =geodetic   # (0:ellipsoidal,1:geodetic)
out-geoid          =internal   # (0:internal,1:egm96,2:egm08_2.5,3:egm08_1,4:gsi2000)
out-solstatic      =all        # (0:all,1:single)
out-nmeaintv1      =0          # (s)
out-nmeaintv2      =0          # (s)
out-outstat        =residual   # (0:off,1:state,2:residual)
stats-eratio1      =300
stats-eratio2      =300
stats-eratio5      =300
stats-eratio6      =300
stats-errphase     =0.003      # (m)
stats-errphaseel   =0.003      # (m)
stats-errphasebl   =0          # (m/10km)
stats-errdoppler   =1          # (Hz)
stats-snrmax       =52         # (dB.Hz)
stats-errsnr       =0          # (m)
stats-errrcv       =0          # ( )
stats-stdbias      =30         # (m)
stats-stdiono      =0.03       # (m)
stats-stdtrop      =0.3        # (m)
stats-prnaccelh    =3          # (m/s^2)
stats-prnaccelv    =1          # (m/s^2)
stats-prnbias      =0.0001     # (m)
stats-prniono      =0.001      # (m)
stats-prntrop      =0.0001     # (m)
stats-prnpos       =0          # (m)
stats-clkstab      =5e-12      # (s/s)
ant1-postype       =llh        # (0:llh,1:xyz,2:single,3:posfile,4:rinexhead,5:rtcm,6:raw)
ant1-pos1          =0          # (deg|m)
ant1-pos2          =0          # (deg|m)
ant1-pos3          =0          # (m|m)
ant1-anttype       =
ant1-antdele       =0          # (m)
ant1-antdeln       =0          # (m)
ant1-antdelu       =0          # (m)
ant2-postype       =single     # (0:llh,1:xyz,2:single,3:posfile,4:rinexhead,5:rtcm,6:raw)
ant2-pos1          =0          # (deg|m)
ant2-pos2          =0          # (deg|m)
ant2-pos3          =0          # (m|m)
ant2-anttype       =
ant2-antdele       =0          # (m)
ant2-antdeln       =0          # (m)
ant2-antdelu       =0          # (m)
ant2-maxaveep      =1
ant2-initrst       =on         # (0:off,1:on)
misc-timeinterp    =off        # (0:off,1:on)
misc-sbasatsel     =0          # (0:all)
misc-rnxopt1       =
misc-rnxopt2       =-EPHALL
misc-pppopt        =
file-satantfile    =
file-rcvantfile    =
file-staposfile    =
file-geoidfile     =
file-ionofile      =
file-dcbfile       =
file-eopfile       =
file-blqfile       =
file-tempdir       =
file-geexefile     =
file-solstatfile   =
file-tracefile     =
# rtkpost options (2025/06/26 06:28:15, v.demo5 b34L)

pos1-posmode       =kinematic  # (0:single,1:dgps,2:kinematic,3:static,4:static-start,5:movingbase,6:fixed,7:ppp-kine,8:ppp-static,9:ppp-fixed)
pos1-frequency     =l1+l2+l5+l6 # (1:l1,2:l1+l2,3:l1+l2+l5,4:l1+l2+l5+l6)
pos1-soltype       =combined   # (0:forward,1:backward,2:combined,3:combined-nophasereset)
pos1-elmask        =15         # (deg)
pos1-snrmask_r     =off        # (0:off,1:on)
pos1-snrmask_b     =off        # (0:off,1:on)
pos1-snrmask_L1    =38,38,38,38,38,38,38,38,38
pos1-snrmask_L2    =0,0,0,0,0,0,0,0,0
pos1-snrmask_L5    =0,0,0,0,0,0,0,0,0
pos1-snrmask_L6    =0,0,0,0,0,0,0,0,0
pos1-dynamics      =on         # (0:off,1:on)
pos1-tidecorr      =0          # (1:solid+2:otl+4:spole)
pos1-ionoopt       =brdc       # (0:off,1:brdc,2:sbas,3:dual-freq,4:est-stec,5:ionex-tec,6:qzs-brdc)
pos1-tropopt       =saas       # (0:off,1:saas,2:sbas,3:est-ztd,4:est-ztdgrad)
pos1-sateph        =brdc       # (0:brdc,1:precise,2:brdc+sbas,3:brdc+ssrapc,4:brdc+ssrcom)
pos1-posopt1       =off        # (0:off,1:on)
pos1-posopt2       =off        # (0:off,1:on)
pos1-posopt3       =off        # (0:off,1:on,2:precise)
pos1-posopt4       =off        # (0:off,1:on)
pos1-posopt5       =off        # (0:off,1:on)
pos1-posopt6       =off        # (0:off,1:on)
pos1-exclsats      =           # (prn ...)
pos1-navsys        =47         # (1:gps+2:sbas+4:glo+8:gal+16:qzs+32:bds+64:navic)
pos2-armode        =fix-and-hold # (0:off,1:continuous,2:instantaneous,3:fix-and-hold)
pos2-gloarmode     =fix-and-hold # (0:off,1:on,2:autocal,3:fix-and-hold)
pos2-bdsarmode     =off        # (0:off,1:on)
pos2-arfilter      =on         # (0:off,1:on)
pos2-arthres       =3
pos2-arthresmin    =3
pos2-arthresmax    =3
pos2-arthres1      =0.1
pos2-arthres2      =0
pos2-arthres3      =1e-09
pos2-arthres4      =1e-05
pos2-varholdamb    =0.1        # (cyc^2)
pos2-gainholdamb   =0.01
pos2-arlockcnt     =0
pos2-minfixsats    =4
pos2-minholdsats   =5
pos2-mindropsats   =10
pos2-arelmask      =15         # (deg)
pos2-arminfix      =100
pos2-armaxiter     =1
pos2-elmaskhold    =15         # (deg)
pos2-aroutcnt      =20
pos2-maxage        =30         # (s)
pos2-syncsol       =off        # (0:off,1:on)
pos2-slipthres     =0.05       # (m)
pos2-dopthres      =0          # (m)
pos2-rejionno      =1          # (m)
pos2-rejcode       =10         # (m)
pos2-niter         =1
pos2-baselen       =0          # (m)
pos2-basesig       =0          # (m)
out-solformat      =nmea       # (0:llh,1:xyz,2:enu,3:nmea)
out-outhead        =on         # (0:off,1:on)
out-outopt         =on         # (0:off,1:on)
out-outvel         =on         # (0:off,1:on)
out-timesys        =gpst       # (0:gpst,1:utc,2:jst)
out-timeform       =hms        # (0:tow,1:hms)
out-timendec       =3
out-degform        =deg        # (0:deg,1:dms)
out-fieldsep       =
out-outsingle      =on         # (0:off,1:on)
out-maxsolstd      =0          # (m)
out-height         =geodetic   # (0:ellipsoidal,1:geodetic)
out-geoid          =internal   # (0:internal,1:egm96,2:egm08_2.5,3:egm08_1,4:gsi2000)
out-solstatic      =all        # (0:all,1:single)
out-nmeaintv1      =0          # (s)
out-nmeaintv2      =0          # (s)
out-outstat        =state      # (0:off,1:state,2:residual)
stats-eratio1      =300
stats-eratio2      =300
stats-eratio5      =300
stats-eratio6      =300
stats-errphase     =0.003      # (m)
stats-errphaseel   =0.003      # (m)
stats-errphasebl   =0          # (m/10km)
stats-errdoppler   =1          # (Hz)
stats-snrmax       =52         # (dB.Hz)
stats-errsnr       =0          # (m)
stats-errrcv       =0          # ( )
stats-stdbias      =30         # (m)
stats-stdiono      =0.03       # (m)
stats-stdtrop      =0.3        # (m)
stats-prnaccelh    =3          # (m/s^2)
stats-prnaccelv    =1          # (m/s^2)
stats-prnbias      =0.0001     # (m)
stats-prniono      =0.001      # (m)
stats-prntrop      =0.0001     # (m)
stats-prnpos       =0          # (m)
stats-clkstab      =5e-12      # (s/s)
ant1-postype       =llh        # (0:llh,1:xyz,2:single,3:posfile,4:rinexhead,5:rtcm,6:raw)
ant1-pos1          =0          # (deg|m)
ant1-pos2          =0          # (deg|m)
ant1-pos3          =0          # (m|m)
ant1-anttype       =
ant1-antdele       =0          # (m)
ant1-antdeln       =0          # (m)
ant1-antdelu       =0          # (m)
ant2-postype       =single     # (0:llh,1:xyz,2:single,3:posfile,4:rinexhead,5:rtcm,6:raw)
ant2-pos1          =0          # (deg|m)
ant2-pos2          =0          # (deg|m)
ant2-pos3          =0          # (m|m)
ant2-anttype       =
ant2-antdele       =0          # (m)
ant2-antdeln       =0          # (m)
ant2-antdelu       =0          # (m)
ant2-maxaveep      =1
ant2-initrst       =on         # (0:off,1:on)
misc-timeinterp    =off        # (0:off,1:on)
misc-sbasatsel     =0          # (0:all)
misc-rnxopt1       =
misc-rnxopt2       =-EPHALL
misc-pppopt        =
file-satantfile    =
file-rcvantfile    =
file-staposfile    =
file-geoidfile     =
file-ionofile      =
file-dcbfile       =
file-eopfile       =
file-blqfile       =
file-tempdir       =
file-geexefile     =
file-solstatfile   =
file-tracefile     =
Simply select .obs and .nav data provided by your rover (generated using convbin above) and .obs data from your base (also generated using convbin above).
The new Android update is here!
We've improved the interface, made settings easier to manage, and added new features to make your everyday navigation with OsmAnd even more smooth and enjoyable.
Thanks for using OsmAnd — safe travels!
• Added support for web and cross-platform purchases.
• Moved Temperature units to General settings for easier access.
• Added battery level indicator for BLE sensors.
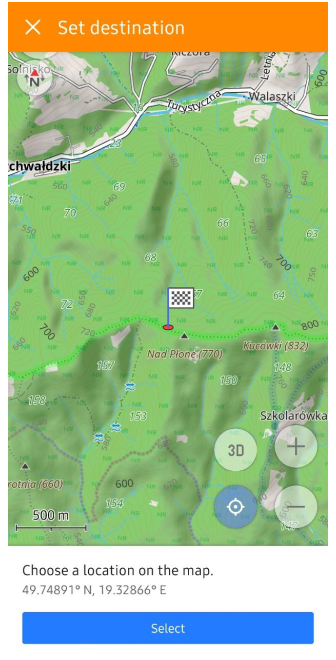
• New, more intuitive UI for point selection in Navigation.
• Improved widget visibility with a new outline.
• Added Uphills/Downhills analyzer.
• Expanded Wikipedia & Wikivoyage integration for more POIs.
• Bug fixes.
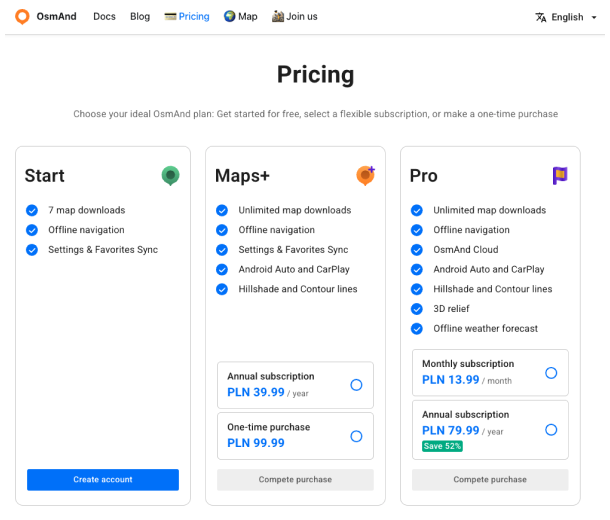
Maps+ and OsmAnd Pro purchases can now be used across different platforms, including Android, iOS, and the OsmAnd website. This means you can buy a subscription on one platform and use it on another without any additional cost.
Now, you can buy OsmAnd products on the OsmAnd website and use them on your Android or iOS devices, and vice versa. This feature is available for all OsmAnd products, including Maps+ and OsmAnd Pro.
The Temperature units setting has been moved to the General settings section for easier access. This change allows you to quickly adjust the temperature units without navigating through multiple menus.
Menu → Configure profile → General settings → Units & formats → Temperature
The battery level indicator for BLE sensors has been added to the Sensors settings section. This feature allows you to monitor the battery status of your connected sensors, ensuring they are always ready for use.
The point selection interface in Navigation has been redesigned to be more intuitive and user-friendly. The new UI allows you to easily select points on the map, making navigation smoother and more efficient.
An outline has been added to widgets, improving visibility and making it easier to interact with them, especially when using transparent widgets.
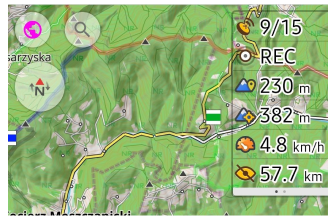
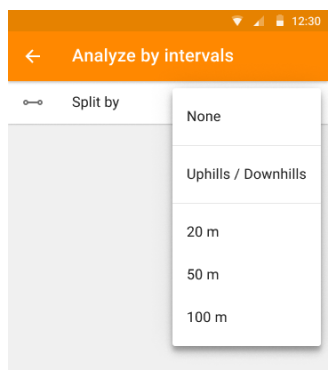
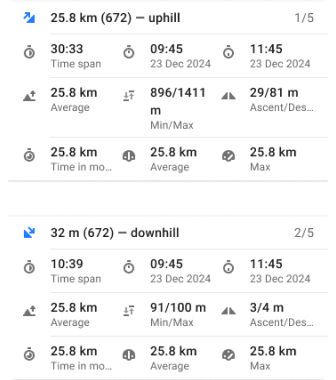
A new Uphills/Downhills analyzer has been added to the Analyze by intervals feature. This tool provides detailed information about the elevation changes along your route, helping you better understand the terrain and plan your activities accordingly.
Wikipedia and Wikivoyage integration has been expanded to include more Points of Interest (POIs). This means you can now access a wider range of information about places around you, enhancing your exploration experience.
If you have suggestions for improving the Android version of the app, please get in touch with us. We appreciate and welcome your contribution to the further development of OsmAnd.
OsmAnd 5.1 for iOS is out now!
We’re excited to bring you the latest update — OsmAnd 5.1 is now available on the App Store. This version includes interface improvements, easier widget configuration, and new features to make exploring even more intuitive.
Download the update and enjoy a better, smoother OsmAnd experience.
Thanks for being with us — safe travels!
• Added support for web and cross-platform purchases
• New Route information widget
• Widgets on the Left & Right panels now include a height option
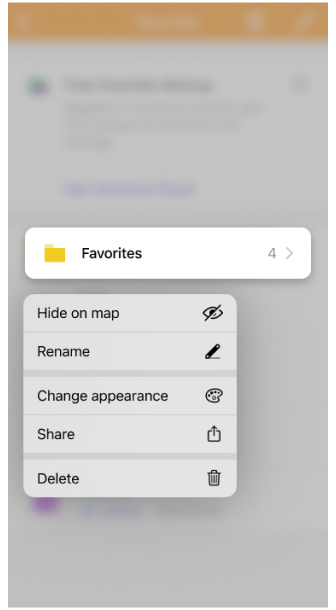
• Added a rename action for Favorite groups.
• Added "Unit of Volume" and "Fuel Tank Capacity" options.
• Added a "Coordinates Grid" overlay.
• Added the ability to assign activities to tracks
• Improved the appearance menu of Favorites
• Bug fixes
Maps+ and OsmAnd Pro purchases can now be used across different platforms, including Android, iOS, and the OsmAnd website. This means you can buy a subscription on one platform and use it on another without any additional cost.
Now, you can buy OsmAnd products on the OsmAnd website and use them on your Android or iOS devices, and vice versa. This feature is available for all OsmAnd products, including Maps+ and OsmAnd Pro.
New Route information widget displays the estimated arrival time, remaining travel time, and distance for the current route. This widget provides essential navigation information at a glance, making it easier to plan your journey and stay informed about your progress.
Menu → Configure screen → Top panel/Bottom panel → Add widget → Navigation Points → Route information
Widgets on the Left & Right panels include a height option, allowing you to customize the size of the widgets to better fit your preferences and screen layout. This change improves the usability of the widgets and makes them more adaptable to different screen sizes.
You can now rename Favorite groups directly from the Favorites menu. This feature allows you to organize your favorites more effectively and quickly access the locations you need.

The "Unit of Volume" and "Fuel Tank Capacity" options have been added to the settings, allowing you to customize how these measurements are displayed in the app. This change enhances the usability of OsmAnd for users who prefer specific units of measurement.
Menu → Settings → App profiles → General settings → Units & Formats → Unit of volume
Menu → Settings → App profiles → Navigation settings → Vehicle parameters → Fuel tank capacity
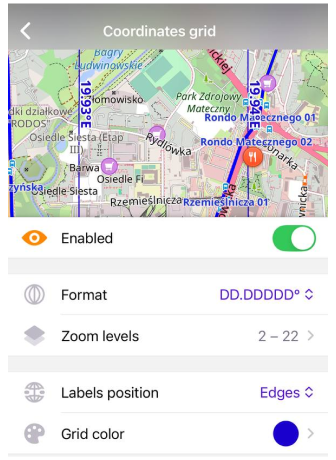
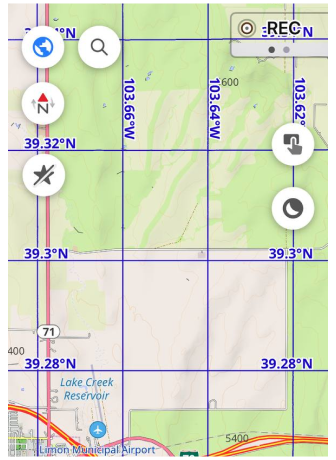
A new "Coordinates Grid" overlay has been added, providing a visual reference for coordinates on the map. This feature is useful for users who need precise location information and enhances the overall map experience.
Configure map → Show on map → Coordinates grid
You can now assign activities to tracks, allowing you to categorize and organize your recorded tracks more effectively. This feature is particularly useful for users who engage in multiple activities, such as hiking, cycling, or running, and want to keep their tracks organized by activity type.
We redesigned the appearance menu of Favorites, allowing you to customize the look of your favorite locations. You can now choose from various icons and colors to make your favorites more visually appealing and easier to identify.

If you have suggestions for improving the iOS version of the app, please get in touch with us. We appreciate and welcome your contribution to the further development of OsmAnd.
Follow:
Follow OsmAnd on Facebook, TikTok, Twitter, Reddit, and Instagram!
Join:
Join us at our groups of Telegram (OsmAnd News channel), (EN), (IT), (FR), (DE), (UA), (ES), (BR-PT), (PL), (AR), (TR).
Get:

Hi everyone,
Today is a special day — OsmAnd is turning 15. An incredible number! It feels like we were just writing posts about our 5th anniversary and 10th anniversary, and now, it's already been fifteen years. Time flies when you're passionate about what you do.
Looking back, I realize that the magic of OsmAnd isn't just about code or maps. Above all, it's about people. And today, I want to give a huge, sincere thank you to the three main communities without whom none of this would be possible.

To the people who create, improve, and support the project every single day. Your dedication, talent, and persistence are the fuel for our shared journey. Thank you for the thousands of hours of work and for pouring your hearts into every detail.
To everyone who sends us code, reports bugs, suggests ideas, and participates in discussions. You are our external brain and our strictest, yet fairest, critics. Your involvement is what makes OsmAnd a truly open and vibrant project. Thank you for your contributions!
Our foundation and main source of inspiration. Every trail, every house, every detail on the map is the work of millions of volunteers from around the world. You are creating a digital copy of the planet, accessible to everyone, and we are proud to be part of this movement. Without you, there would be no us. Thank you!
The scale of this journey is truly humbling. Over the past 15 years, we’ve delivered more than 35 releases for the Android version — and over 25 releases for iOS since its launch.
Today, we’re proud to share these global stats:
All these 15 years can be roughly divided into three stages. For the first five years, we built the very basic functionality—offline maps and navigation that just worked. Over the next five years, we transformed OsmAnd into a full-fledged application with plugins, extensive settings, and professional tools. We dedicated the third five-year period to deep internal work: completely rewriting and improving key components like the rendering engine and routing algorithms.
Now, a new, fourth stage begins. We have reached functional maturity, and our main goal for the near future is to polish what we’ve already built. We will focus on stability, speed, and consolidation. User expectations are growing, and what was once considered normal must now be flawless. The application must run faster, be more stable, and feel more cohesive.
How will we achieve this? Through immense attention to detail: deep analysis, manual and automated testing. We will move in fast but very small steps, carefully monitoring the results and listening to your feedback. Our task is to consolidate existing functionality, making it more intuitive and reliable.
I believe this approach will allow us to build a solid foundation. And after that, we can focus with renewed energy on the major, long-awaited features that you constantly write to us about and for which we previously lacked the time.
What's a birthday without gifts? To celebrate our anniversary, we've prepared several great surprises for you! To take advantage of them, make sure you have the latest version of the app, 5.1, installed.
Thank you for being with us all these years. Our journey continues, and the most exciting parts are still ahead!
With warmth and gratitude,
Victor Shcherb CEO of OsmAnd
In the early days of mapping and cartography experiments, GPS tracks were often the starting point. Contributors to the OpenStreetMap (OSM) project, especially before 2010, relied heavily on GPS devices. They would walk or cycle routes and later upload their recorded tracks and observations to OSM. Today, GNSS-capable devices are everywhere: smartphones, smartwatches, action cams, and drones. These tools don’t just record where things are, but also what they are, through images, videos, and other sensor inputs. This opens up new possibilities for mobile mapping. I recently tried something new: drone-based tracking in Active Mode—a self-experiment in modern mobile mapping.

What did the test setup look like, and which devices were used? For my tests mapping various paths and (MTB) trails, I used a range of devices and configurations. I flew two drones: the DJI Avata (2024) and the DJI NEO (2024). For the action cam, I used a GoPro HERO 12 Black, and I also wore a Garmin fēnix® 8 smartwatch. My overall goal was to evaluate the GPS accuracy of these different devices. The tests were conducted on closed-off field and forest paths. Differentiating between open terrain, wooded trails, and steep sections helped account for potential signal interference from satellite shading.
How can the relevant data be accessed? The GPS tracks from the DJI drones can be exported from their log files, found in the DJIFlightRecord directory of the DJI Fly App (on iOS, in my case). I used the free tool dji-log-parser to extract the GPS data. To extract the GPS track from GoPro video footage (using GPMF metadata), I used the Python package gpmf. Below is a screenshot from JOSM (an OSM editor), showing part of the recorded GPS tracks for a test route. During the test, the GoPro and Garmin watch were worn by the person. The NEO drone followed the person in Active Tracking mode, while the Avata was flown separately using FPV.
What results did these first tests yield? Both the Avata and the NEO provided GPS tracks, but compared to the “reference” route, deviations of several meters were common. The tracking mode itself influenced the recorded path, especially when the drone followed from behind or at an angle. The GoPro produced similar results, with tracks that were sometimes even farther off than the drones. In contrast, the Garmin watch delivered the most “accurate” and consistent GPS data in my forest-area tests.
My personal conclusion? A drone in tracking mode is great for YouTube videos, but due to GPS accuracy limitations, it’s only conditionally suitable for direct mobile mapping, at least with the drones I tested and at my running or cycling speeds. I was a bit disappointed by the GoPro’s positioning accuracy; I expected better performance given its capabilities. The biggest surprise? The Garmin watch—its GPS track was by far the most reliable throughout my experiments.
Side Note: The DJI Mini 4 Pro, an Insta360 One RS, and a DJI Osmo were also partially used during the tests. However, due to the Mini 4 Pro’s size and the lack of GPS in the Insta360, I haven’t included them in detail here. Otherwise, this post would have gotten way too long 
PS: The mapped MTB trails from the FlowTrail Heidenrod can now be found on OSM  Relation
I recently updated this map:
♦
and this one:
♦
to show different types of restaurants (the most common cuisine types cause the top part of the icon to be modified), just like that map has shown fast food for some time now. However, it’s not technically difficult to also show what wheelchair access is available - this one:
♦
is an Italian restauran
I recently updated this map:
and this one:
to show different types of restaurants (the most common cuisine types cause the top part of the icon to be modified), just like that map has shown fast food for some time now. However, it’s not technically difficult to also show what wheelchair access is available - this one:

is an Italian restaurant with limited wheelchair access. The yellow flash for that is deliberately small so as to not dominate the view, but visible if you are looking for it.
Shouldn’t showing that information be “table stakes” for maps showing OSM data?
I had a fantastic time at SOTM US. Thanks to all at OSM US for their work putting the event together.
I gave two presentations, one on MapRoulette and one on the new Meet Your Mappers tool. I posted annotated slides for the MapRoulette talk on my blog.
I had a fantastic time at SOTM US. Thanks to all at OSM US for their work putting the event together.
I gave two presentations, one on MapRoulette and one on the new Meet Your Mappers tool. I posted annotated slides for the MapRoulette talk on my blog.


