Timișoara
Ich hatte mit dem Besuch der FOSS4G Europe 2026 Gelegenheit Timișoara in Rumänien kennen zu lernen. Die Region kannte ich bisher nicht.
Es war leicht in dieser Stadt mit fußläufigen Entfernungen eine Unterkunft zu finden, die sich sehr zentral und nahe am zeitgleich stattfindenden Jazzfestival befand.
Die Stadtgeschichte lernte ich zwar erst im Rahmen der Exkursion am Samstag, kurz vor der Abreise kennen, doch ich will damit beginnnen.
Timișoara ist eine multikulturelle Stadt im Westen Rumäniens gelegen. Die Geschichte reicht weit über tausend Jahre zurück, die Stadt wurde zwischen den verschiedenen Reichen (Römisches Reich, Residenz ungarischer König, Osmanisches Reich, Türkische Herrschaft, Österreich-Ungarn, … Kommunismus) hin und her gerissen, dies hatte große Auswirkungen auf die Stadtentwicklung, die schon sehr früh (~ 500) begann. Im 11. Jh. urkundlich erwähnt, später immer wieder zerstört, im 13. Jh. Ungarisches Reich, 14 Jh. Zerstörung durch Erdbeben, 15 Jh. von den Osmanen wieder aufgebaut. Unter der Habsburger Herrschaft erfolgte der Umbau zur Festungs- und Garnisonsstadt, im dem große Teile abgerissen und nach Plan aufgebaut wurden. Diese sogenannte Planstadt ist heute die größte Fußgängerzone Europas und ermöglicht eine gute Orientierung in der Stadt. Der Anschluss ans Eisenbahnnetz erfolgte 1857 und 1884 bekam die Stadt eine der ersten elektrischen Straßenbeleuchtungen in Europa.
Timișoara hat viele schöne Gebäude im Gründerzeit- und Jugendstil, die aus der wirtschaftlichen und kulturellen Blüte stammen. Aus diesem Grund wird Timișoara auch “Klein-Wien” genannt.
Die Stadt zeichnet sich durch sehr viel Grün und sehr viele Bäume aus. Eine sehr große Grünfläche, der heutige Bürgerpark, ist vorhanden, weil Nicolae Ceaușescu sein Programm zur Systematisierung der Dörfer, welches mit Plänen der Beseitigung von bürgerlichen Wohnstrukturen einher ging, zum Glück, nicht zu Ende bringen konnte. Dieses Programm sollte auf dem Land mehr landwirtschaftliche Nutzfläche und in der Stadt sozialistische Stadtviertel hervorbringen.
Die Revolution, die 1989 das kommunistische Regime in Rumänien stürzte, begann in Timisoara.
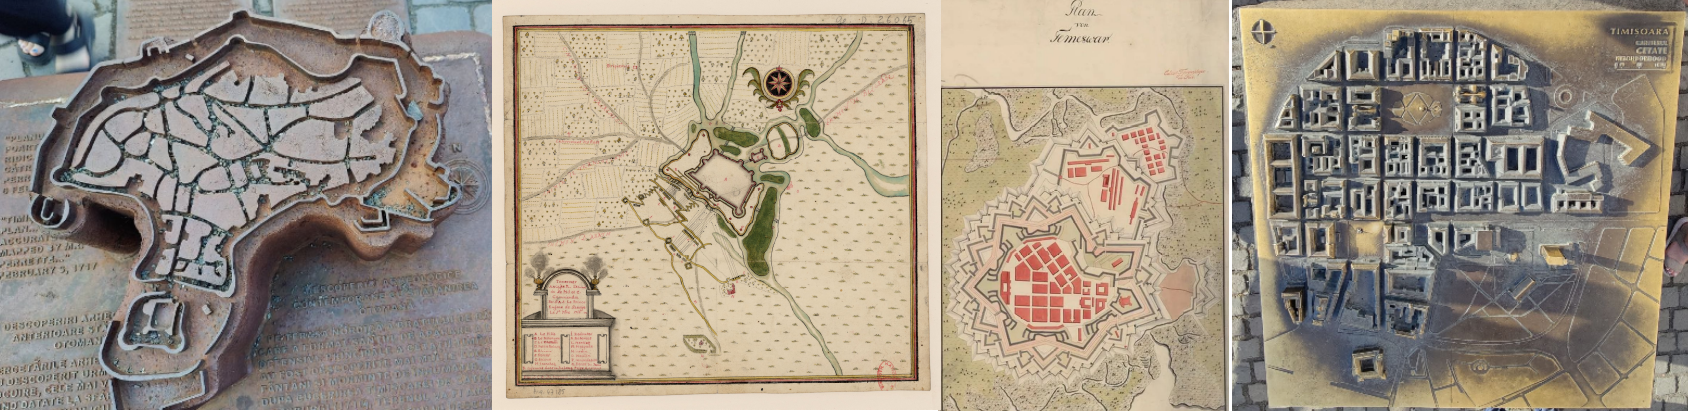
Pläne und Reliefdarstellungen Timișoara
Die 3D-Abbildung links stellt ein Relief der osmanischen Befestigungsanlagen dar. Daneben befindet sich ein Bild der berühmtesten Karte aus dem Jahr 1716, Kapitän Francois Perrette zeichnete sie im Zuge des Venezianisch-Österreichischen Türkenkrieges und hatte den Auftrag die Festungsstadt exakt zu vermessen. Im Jahr 1775 entstand die Planzeichnung der Festung Temeswar, als Vorlage für den Umbau in eine moderne Stadt nach europäischen Prinzipien. Anstelle des alten Straßengewirrs wurde ein streng rationales, rechtwinkliges Straßennetz durchgesetzt. Das Relief ganz rechts zeigt ein taktiles Stadtmodell, welches im Zuge der umfassenden Modernisierung und Umwandlung in Fußgängerzonen in den 2010er Jahren im Zentrum der Stadt aufgestellt wurde. Im Jahr 2023 war Timișoara Kulturhauptstadt Europas, das Motto „Shine Your Light!“ („Lass dein Licht leuchten“) ist eine Anspielung darauf, dass die Stadt 1884 die erste in Europa mit elektrischer Straßenbeleuchtung war und 1989 den Ausgangspunkt der Revolution gegen das Ceaușescu-Regime bildete. Dem Titel Kulturhauptstat hat die Stadt mit dem gleichzeitig stattfindenen Festivalul Inimilor und dem JAZZx 2026 Festival alle Ehre gemacht.
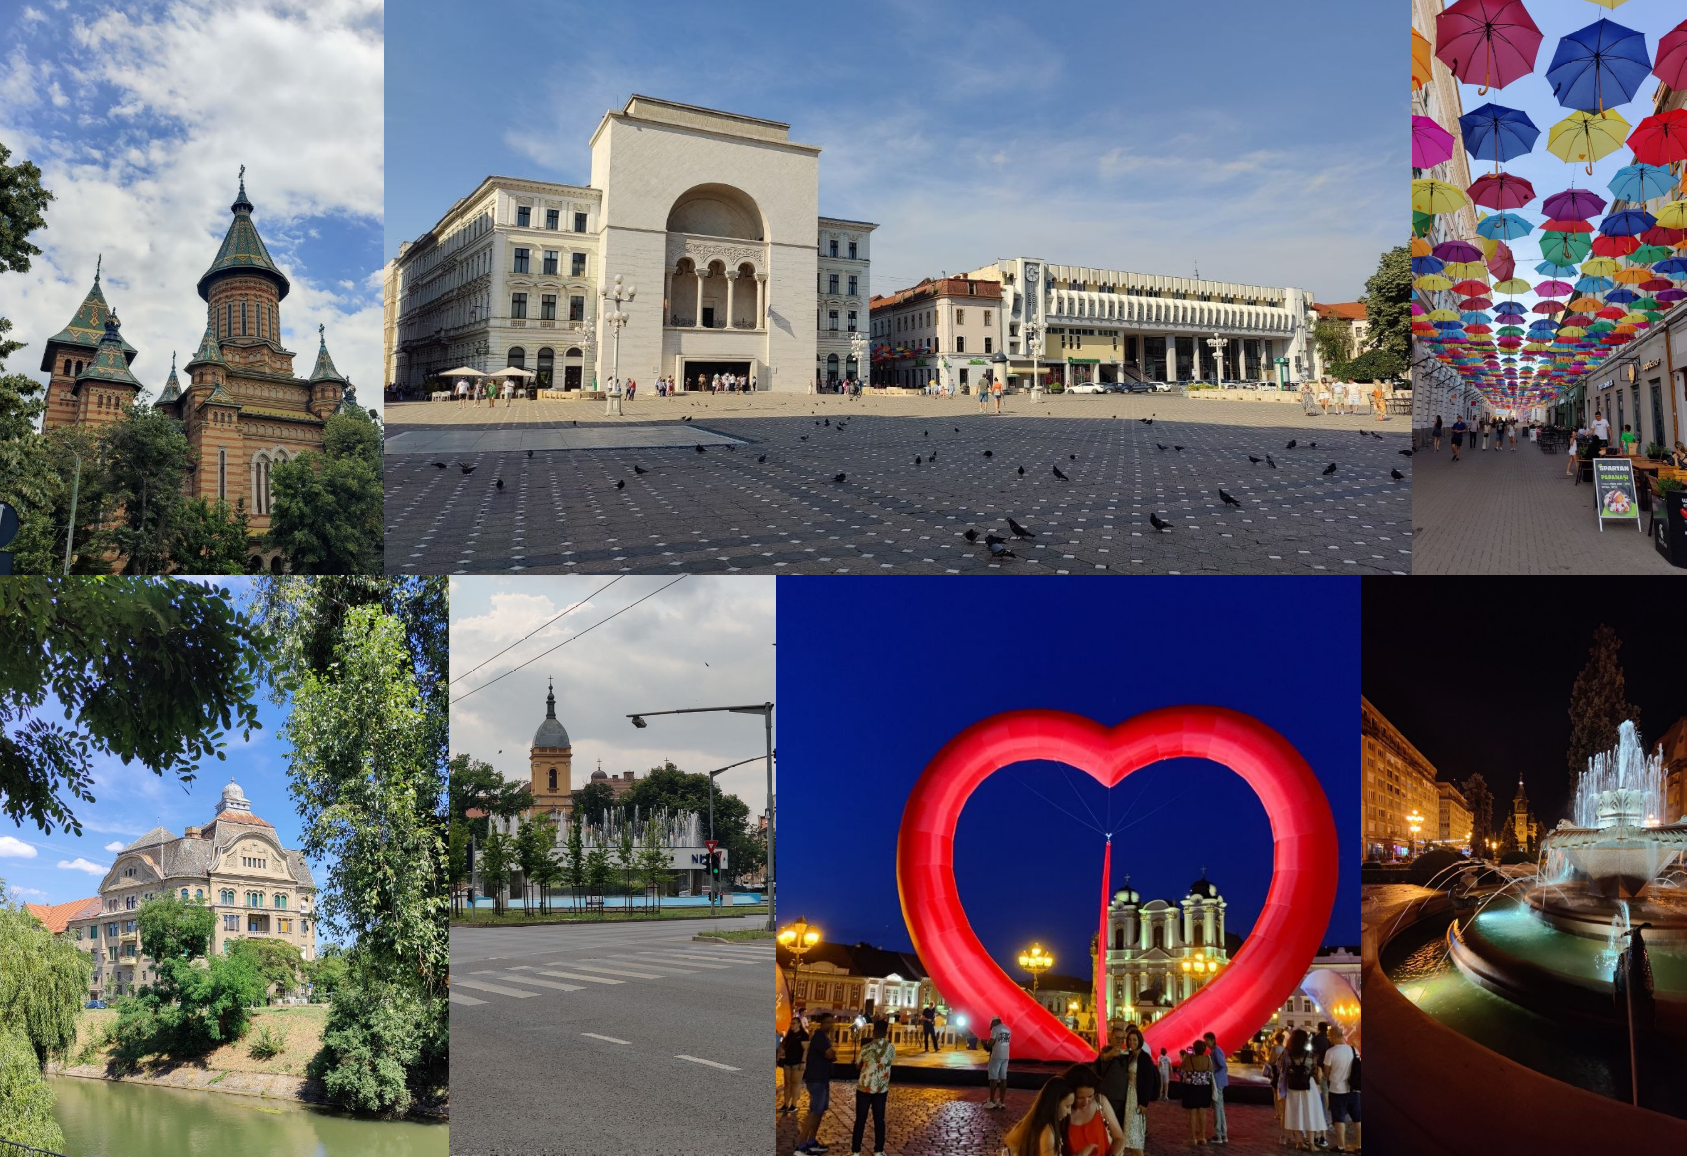
Eindrücke von der Stadt, Fotos: Hafi
FOSS4G Europe fand vom 29. Juni bis 5. Juli 2026 statt
Die FOSS4G Europe fand mit mehr als 300 Teilnehmenden erfolgreich in Timișoara in Rumänien statt. Das Programm war vielseitig und spannend. Eine FOSS4G Europe gibt es immer dann, wenn auf dem Kontinent Europa keine globale FOSS4G stattfindet.
Insgesamt kann die Überschrift, “the world is changing” über die Veranstaltung gesetzt werden. Angesichts der geopolitischen, technologischen und wirtschaftlichen Veränderungen, mit denen Europa derzeit konfrontiert ist, bot die FOSS4G Europe ein Diskussionsforum, um über Digitale Souveränität, anstehende Aufgaben zur Entwicklung und Anpassung von Open-Source-Software (OSS), der Rolle der OSGeo Foundation als Organisation sowie über zahlreiche OSGeo-Projekte zu diskutieren.
In der Eröffnungsveranstaltung stellten Tom Kralidis, Jeroen Ticheler und Codrina Ilie den aktuellen Status der OSGeo Foundation dar und formulierten das Ziel, die OSGeo zu modernisieren, finanziell stabiler aufzustellen sowie den Sitz in Europa anzusiedeln, um OSGeo für mehr europäische Initiativen zu öffnen. Auch die Mitgliederstruktur soll überdacht werden. Bisher hat die OSGeo Charter Members. Um Charter Member zu werden, muss eine Nominierung durch ein Mitglied erfolgen. Zu diesem Thema fand ein BoF (“Birds of a Feather”, ein informelles Treffen) statt, hier wurden einzelne Aspekte beleuchtet und dokumentiert.
Der Keynote-Vortrag CONTRIBUTING.md for Europe: Time to fork the policy repo?, in welchem Stefanie Lumnitz Beteiligungsmöglichkeiten an EU-Richtlinien vorstellt, eröffnet den Tag für verschiedenen Vorträge zur europäischen Perspektive. Zunächst ging es um die Open Source Strategie der Europäischen Kommission, das darin liegende Potential und auch die sich aus einer Beteiligung ergebenden Herausforderungen. Stefanie Lumnitz zieht einen interessanten Vergleich heran und vergleicht die EU mit dem FOSS4G-Ökosystem, erläutert die Beteiligungsmöglichkeiten für die Community an Richtlinien mitzurbeiten und erläutert die einzigartigen Strukturen der EU.
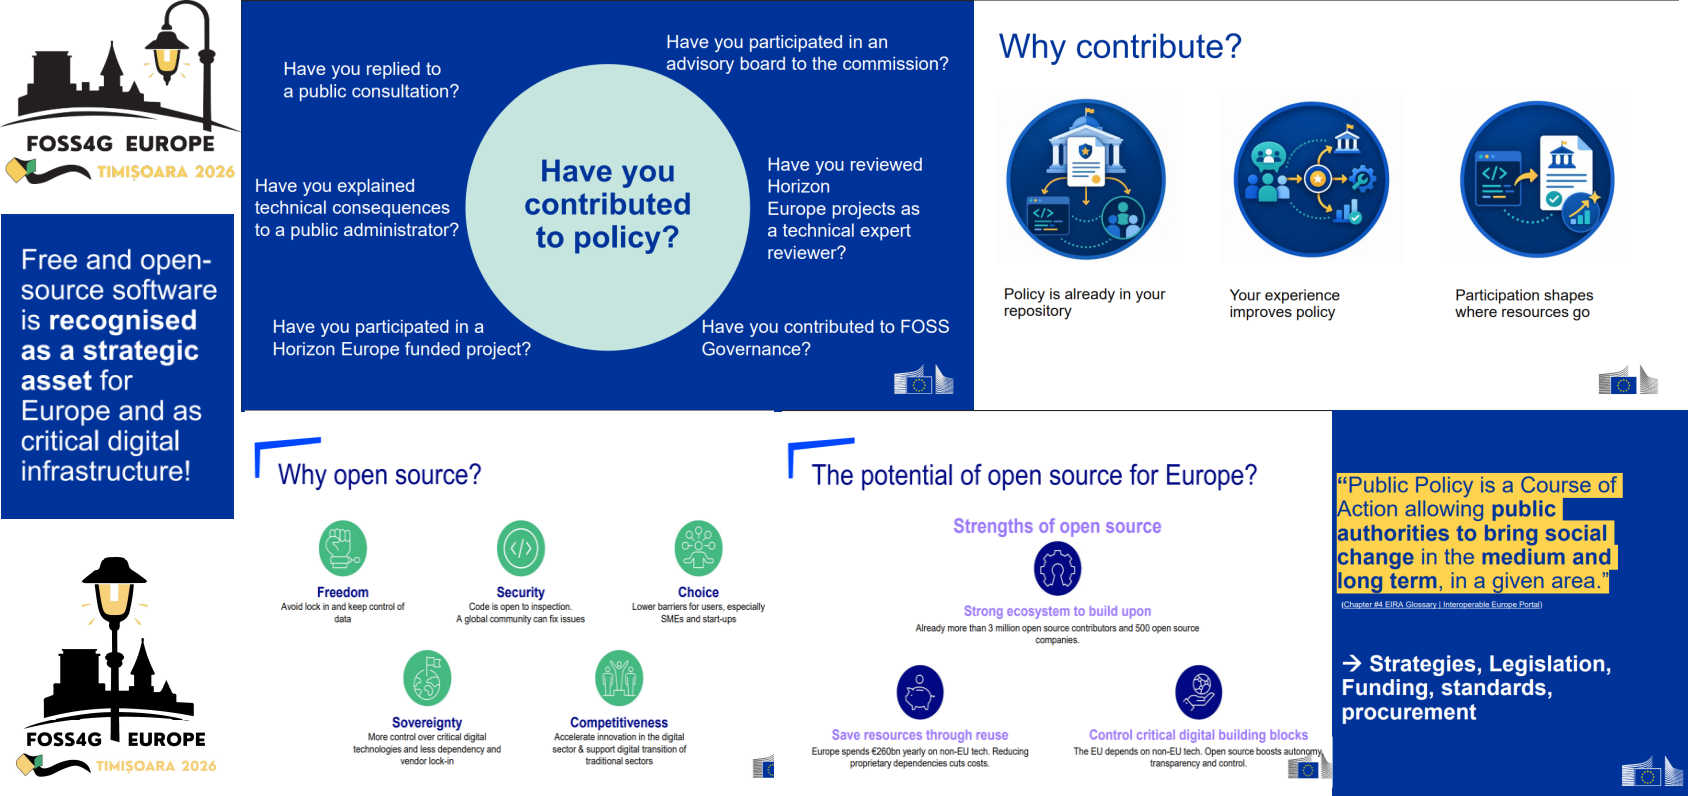
Möglichkeiten und Aufruf zur Beteiligung an Beiträgen und EU-Richtlinien (Screenshots aus den Vortragsfolien)
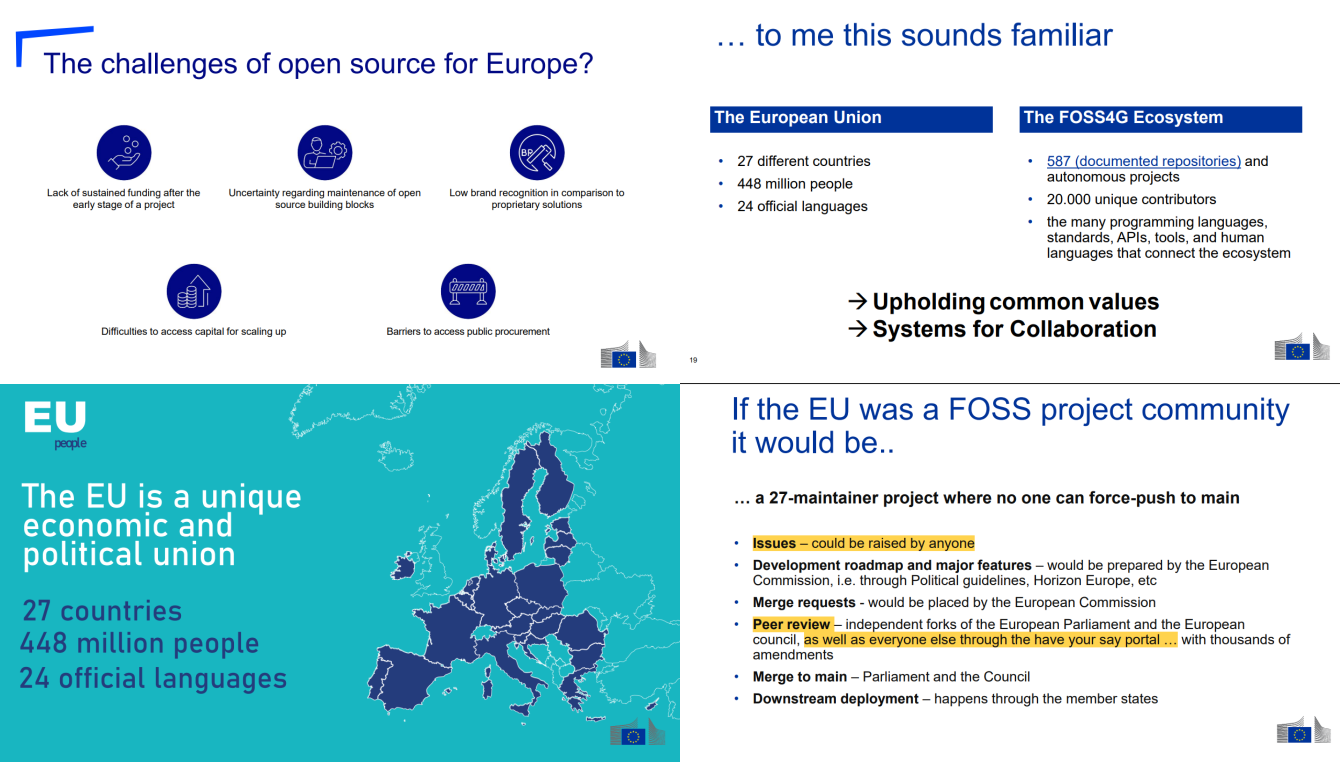
Open Source in Europa - Wäre die EU ein Freie OpenSourceSoftware-Projekt, hätte es 27 Betreuer, bei dem niemand einen Push in den Hauptzweig vornehmen kann. (Screenshots aus den Vortragsfolien)
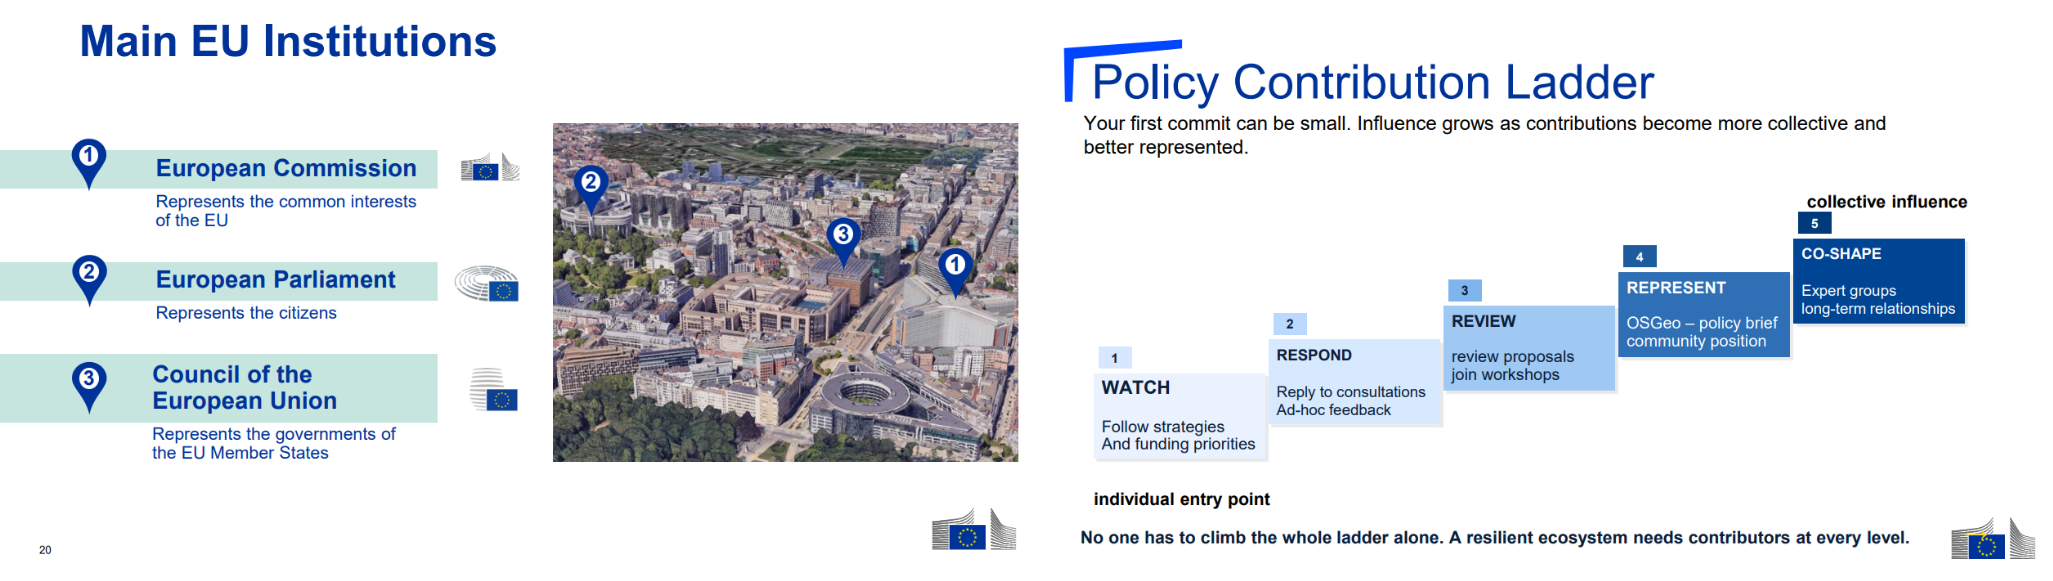
Links: Institutionen der Europäischen Union, rechts: Ablauf für Beiträge zu einer EU-Richtlinie (Screenshots aus den Vortragsfolien)
Im Beitrag Open Source, Digital Sovereignty and Europe’s Geospatial Future sprechen Marco Minghini und Stefanie Lumnitz über eine eine neue geopolitische Phase, in der digitale Technologien als Infrastruktur der Mächte dienen und erläutern die aktuelle politische Dynamik, u.a. der deutsch-französische Dialog, die Wiener Erklärung zur digitalen Souveränität sowie die Entschließung des Europäischen Parlaments zu technologischer Souveränität von digitalen Infrastrukturen. Darüber hinaus weisen sie auf das Risiko des „Sovereign-Washing“ hin, die Prioritätensetzung einzelner Akteure ist nicht immer klar. Der Aufruf geht an die Mitglieder der Community, sich als Expert:in für die Bewertung von Anträgen auf EU-Fördermittel zu engagieren. Dabei ist man als Einzelperson tätig und unterstützt die EU-Dienststellen bei der Umsetzung von EU-Förderungen und Ausschreibungen, die über das Portal verwaltet werden.
Die Folien zum Vortrag enthalten weitere interessante Informationen.
Links: Institutionen der Europäischen Union, rechts: Ablauf für Beiträge zu einer EU-Richtlinie (Screenshots aus den Vortragsfolien)
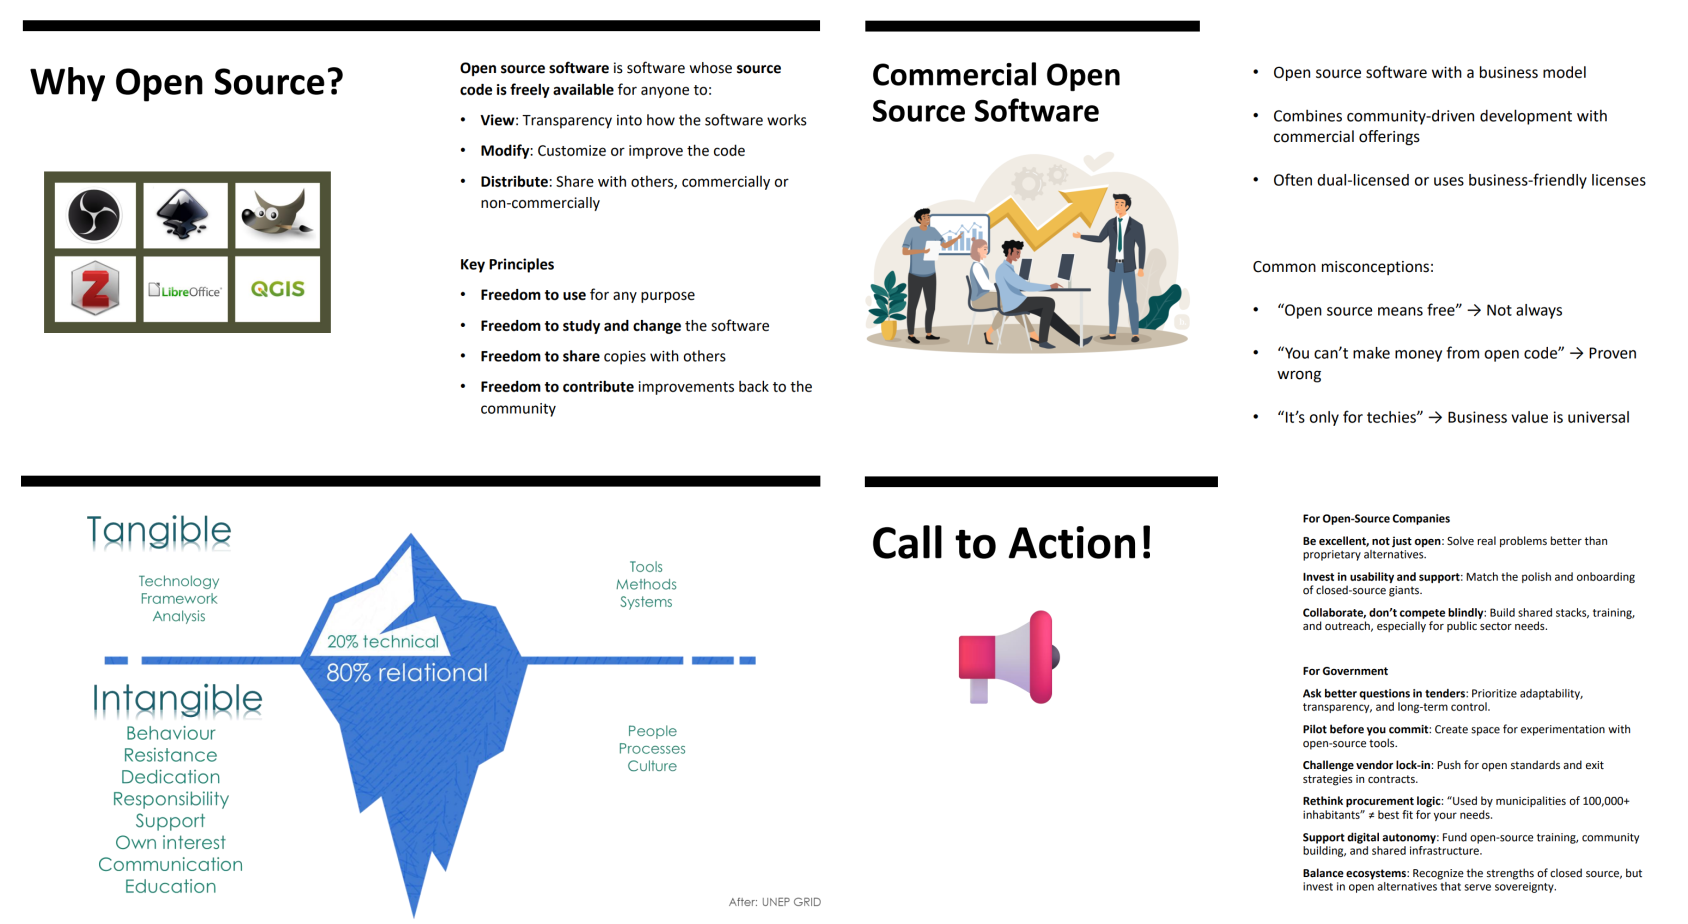
Hans van der Kwast illustriert in seinen Vortrag Open Source for Digital Sovereignty: Business Models, Trustmarks, and Procurement Reform die Diskussion rund um Digitale Souveränität und rechtliche Widersprüche. Er ruft auf Firmen zu gründen. Das Eisbergbild zeigt recht schön, welche Ressourcen gut greifbar und welche eher immaterieller Natur sind, verbunden mit dem Aufruf zum Handeln. “Echte Open-Source-Unternehmen leisten einen Beitrag zur Community!”, indem sie in Benutzerfreundlichkeit und Support investieren, zusammen arbeiten und sich auf die Bedürfnisse des öffentlichen Sektors einlassen. Behörden sind aufgerufen mehr Wert auf Anpassungsfähigkeit, Transparenz und langfristige Kontrolle ihrer IT-Infrastruktur zu legen und die Beschaffungslogik zu überdenken. Der Aufbau von Communities und gemeinsam investierter Infrastruktur kann Open Source Ökosysteme ins Gleichgewicht bringen.
Jeroen Ticheler stellt Nachhaltigkeitsstrategien vor, die OSS-Projekte langfristig gesund halten. Ausgehend davon, dass OSS von allen genutzt und von wenigen finanziert wird, zudem jedoch dem realen Wettbewerb unterliegt, zeigt er welche Geschäftswege helfen bzw. zusammenwirken sollten, um ein OSS-Projekt zu erhalten, sowie erfolgreich und im Wettbewerb beständig zu machen. Hier spielen Beratungs- und Produktorientierung zusammen: Im beratungsorientierten Ansatz steht der Zugang zu Fachwissen im Vordergrund, was durch Schulungen, Support oder integrierten Funktionen bereitgestellt werden kann. Bei der Produktorientierung, geht es um das ausgereifte Produkt, welches paketiert und dokumentiert einen Mehrwert schafft, Sicherheit für Nutzende bedeutet und Investitionen bei den Erstellenden ermöglicht. Letztendlich hat jeder die Wahl mitzuwirken, zu investieren oder zu beschaffen.
Open Source funktioniert nicht nur wegen des offenen Quellcodes, sondern auch weil Zusammenarbeit, Transparenz, Gemeinschaftsvereinbarungen eine langfristige Nachhaltigkeit ermöglichen.
Das IGN Frankreich (Institut national de l’information géographique et forestière) hat sich für “OSS by default” entschieden und stellt Open-Source-Werkzeuge vor, die für die Klassifizierung der riesigen Lidar-Datenmengen im Rahmen des nationalen „Lidar HD"-Programms entwickelt wurden und welche Rolle sie spielen. Dazu gehören Projekte wie Myria3D (KI-basierte Klassifizierung), Coclico (Vergleichstool) und Lidro (Verarbeitung von Wasserläufen), die wichtige Open-Source-Bibliotheken (wie PDAL, GDAL, PROJ) nutzen und allesamt auf GitHub unter der Organisation IGNF verfügbar sind, Link zum Vortrag: Boosting QGIS: What France’s Mapping Agency Adds to the Toolbox.
Antoine Lavende vom IGN stellt die strategische Bedeutung von Digital Commons für den Aufbau einer nachhaltigen und kollaborativen Zukunft in den Mittelpunkt und ist an mehreren Vorträgen beteiligt, in denen die französiche Kartenagentur ihren Beitrag zum OSS-Ökosystem darstellt.
Das spannende FOSS4G Europe Programm enthielt noch viel mehr sehr interessante Beiträge, um wichtigen Projekten, Ergebnissen und Erkenntnissen Raum zu geben. Die Videoaufgezeichnungen werden nach Aussage der Organisatoren in Kürze veröffentlicht.
Viele OSGeo-Projekte berichten über den Status Quo und aktuelle Entwicklungen.
Iván Sánchez Ortega hat sich Gedanken darüber gemacht, wie viele Koordinatensysteme es in einer Webkarte gibt und dies sehr schön in seinen Folien zum Vortrag illustriert.
Codrina Ilie spricht über das Open Earth Monitor Cyberinfrastructure Projekt, welches dazu dient besser zu verstehen, was Klimawandel für die Gesellschaft bedeutet. Sie stellt ein klares Bild zu Risiken auf, denen der private europäische Sektor aufgrund des Klimawandels ausgsetzt ist.
Ein großes Thema sind KI und LLMs, u.a. betrachtet Florent Gravin wie Open Source AI auf Geoinformation trifft und erläutert Funktionsweisen von GeoLLM und welche Basis und Orchestrierung es braucht. Open-Source-GeoLLM-Tools sind bereits Realität und einsatzbereit mit semantischer Suche und Funktionsaufrufen. Sie lassen jedoch wenig Aussagen zur Datenqualität zu und wie das Modell in der Größe optimierbar ist, bleibt offen. Er hält fest, dass Open Source aufgrund der Datenhoheit unverzichtbar ist und plädiert für offene Modelle, offene Daten und offene Tools, um eine souveräne, fundierte GeoAI zu schaffen, die vertrauenwürdig erscheint, weil die Mensch-Maschine-Interaktion transparent ist.
Die Initiative der QGIS-Trainer traf sich auf der Konferenz. Sie hatten sich auf der letzten FOSS4G Europe 2025 in Mostar verabredet, ein Netzwerk aufzubauen. Die Initiative wurde fortgesetzt und es gab einen Austausch von Ideen zur Zusammenarbeit.
Nach drei Konferenztagen folgten 2 Tage mit zahlreichen Workshops, die sehr gut besucht waren. Am Wochenende fand dann zum Abschluss der Community Sprint statt.
Die nächste globale FOSS4G findet vom 30.08. – 05.09.2026 in Japan in Hiroshima unter dem Motto „Bridging Geospatial Technology and Humanity“ statt.
Im Jahr 2027 wird die globale FOSS4G in Bristol (UK) stattfinden. Die FOSS4G Europe wird erst wieder in 2028 stattfinden. Ein Austragungsort wird noch gesucht.
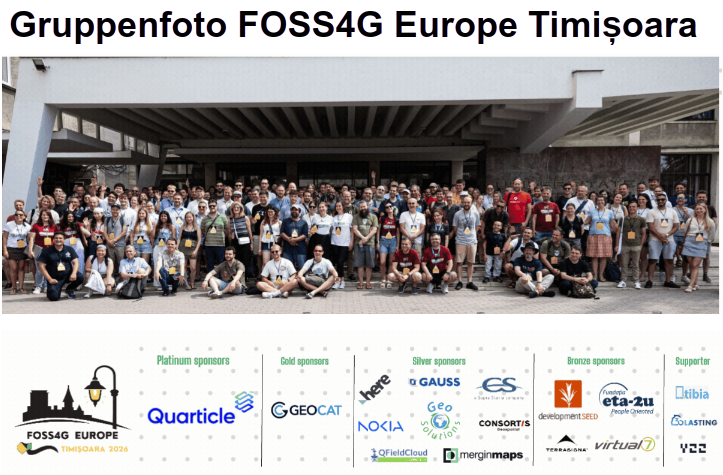
Gruppenfoto FOSS4G Europe 2026 (Quelle: LinkedIN)


 ►
► ►
► ►
► ►
►
 Mapping missing buildings in La Paz, Bolivia


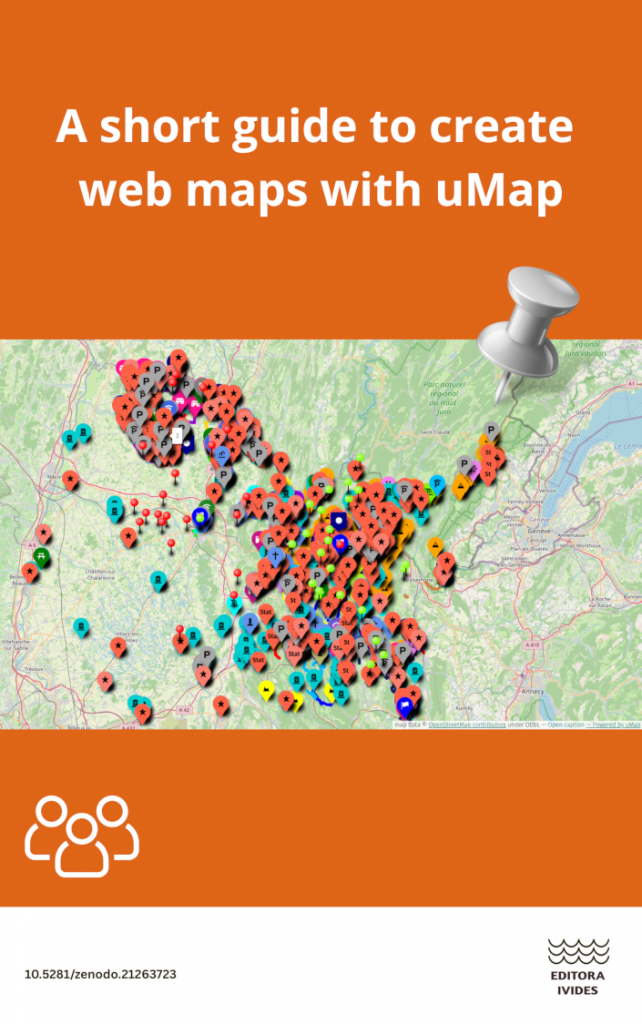 Front cover of the ebook A short guide to create web maps with uMap. Source of image and map data (c) 2026 OpenStreetMap contributors,
 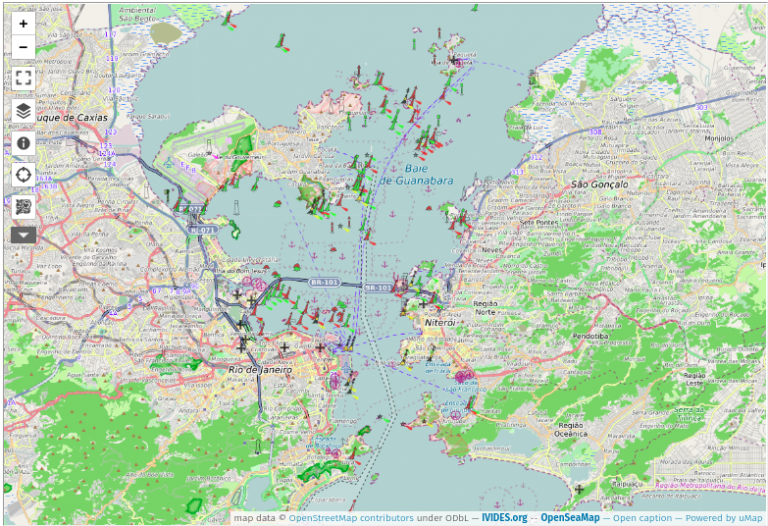 uMap
uMap 
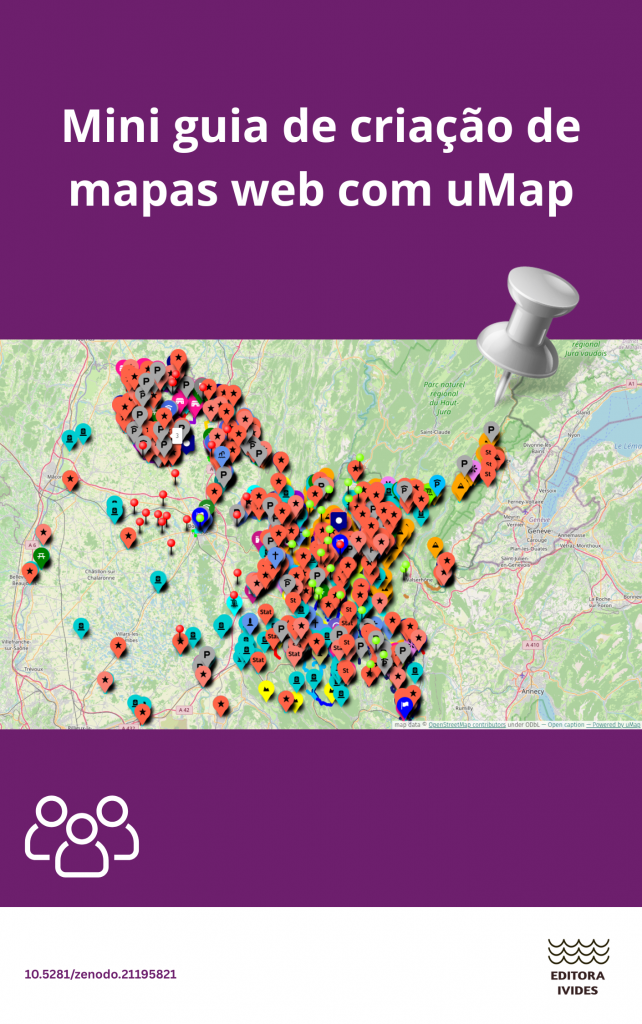 Capa do e-book Mini guia de criação de mapas web com uMap. Fonte da imagem e dos dados do mapa: colaboradores do OpenStreetMap,